Google Chrome Developer Tools
Description: Google Chrome Developer Tools are a set of web developer tools built directly into the Google Chrome browser. They allow developers to edit pages and JavaScript on the fly, debug issues, monitor network requests, simulate mobile experiences, and improve workflow and productivity.
Type: software
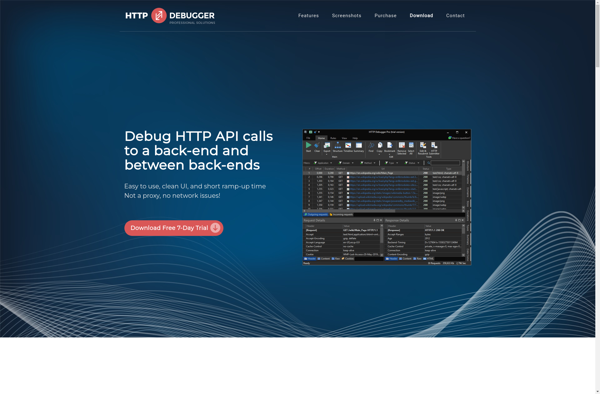
HTTP Debugger
Description: An HTTP debugger is a tool that allows developers to inspect, debug and test HTTP requests and responses. It provides visibility into headers, cookies, caching, redirects and other aspects of HTTP communication.
Type: software