x64dbg vs WinDbg

Struggling to choose between x64dbg and WinDbg? Both products offer unique advantages, making it a tough decision.

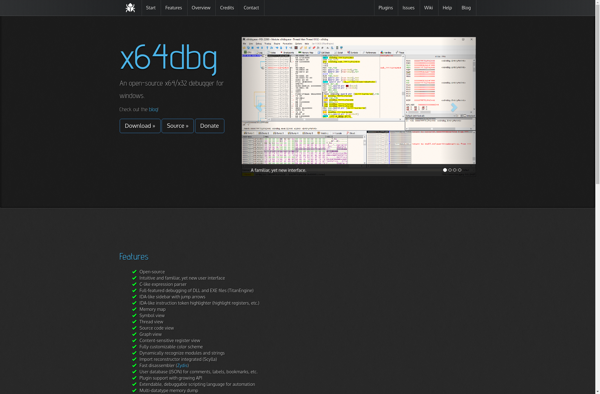
x64dbg is a Development solution with tags like debugger, reverse-engineering, windows, x64, x32.

It boasts features such as Open source, Supports x64 and x32 Windows processes, Conditional breakpoints, Tracing execution, Dumping memory, Editing memory and registers, Plugin support and pros including Free and open source, Full-featured debugger, Active development and community support, Highly customizable via plugins, Clean and intuitive UI.

On the other hand, WinDbg is a Development product tagged with debugger, windows, crash-analysis, assembly-debugging.

Its standout features include Assembly-level debugging, Memory inspection, Call stack tracing, Breakpoint setting, Watch variable tracking, Dump file analysis, and it shines with pros like Powerful low-level debugging, Integrated with Visual Studio, Can debug user and kernel mode, Rich set of commands, Free and included with Windows SDK.

To help you make an informed decision, we've compiled a comprehensive comparison of these two products, delving into their features, pros, cons, pricing, and more. Get ready to explore the nuances that set them apart and determine which one is the perfect fit for your requirements.

x64dbg

x64dbg

x64dbg is an open-source x64/x32 debugger for Windows. It is used mainly for analyzing and reverse engineering Windows applications and has features like conditional breakpoints, tracing execution, dumping memory, editing memory and registers, and more.

Categories:
debugger reverse-engineering windows x64 x32

X64dbg Features

  1. Open source
  2. Supports x64 and x32 Windows processes
  3. Conditional breakpoints
  4. Tracing execution
  5. Dumping memory
  6. Editing memory and registers
  7. Plugin support

Pricing

  • Open Source

Pros

Free and open source

Full-featured debugger

Active development and community support

Highly customizable via plugins

Clean and intuitive UI

Cons

Windows only

Steep learning curve

Lacks some features of commercial debuggers

Can be unstable with some processes


WinDbg

WinDbg

WinDbg is a powerful Windows debugging tool used mainly for analyzing crashes and errors in Windows applications and drivers. It provides detailed assembly-level debugging and can be used to inspect live programs or crash dumps.

Categories:
debugger windows crash-analysis assembly-debugging

WinDbg Features

  1. Assembly-level debugging
  2. Memory inspection
  3. Call stack tracing
  4. Breakpoint setting
  5. Watch variable tracking
  6. Dump file analysis

Pricing

  • Free
  • Open Source

Pros

Powerful low-level debugging

Integrated with Visual Studio

Can debug user and kernel mode

Rich set of commands

Free and included with Windows SDK

Cons

Steep learning curve

Command line interface only

Difficult for beginners

Limited documentation and support