Cevelop vs WinDbg

Struggling to choose between Cevelop and WinDbg? Both products offer unique advantages, making it a tough decision.

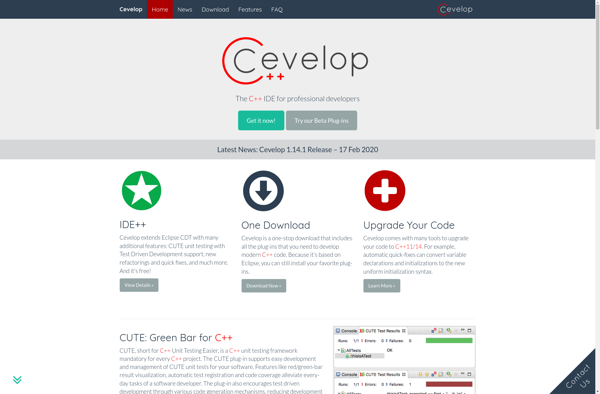
Cevelop is a Development solution with tags like c, ide, eclipse, code-assistance, refactoring.

It boasts features such as Code completion, Refactoring, Debugging, Project management, Version control integration, Code analysis and pros including Good C++ support, Fast and responsive interface, Helpful code assistance, Integration with CMake and other tools.

On the other hand, WinDbg is a Development product tagged with debugger, windows, crash-analysis, assembly-debugging.

Its standout features include Assembly-level debugging, Memory inspection, Call stack tracing, Breakpoint setting, Watch variable tracking, Dump file analysis, and it shines with pros like Powerful low-level debugging, Integrated with Visual Studio, Can debug user and kernel mode, Rich set of commands, Free and included with Windows SDK.

To help you make an informed decision, we've compiled a comprehensive comparison of these two products, delving into their features, pros, cons, pricing, and more. Get ready to explore the nuances that set them apart and determine which one is the perfect fit for your requirements.

Cevelop

Cevelop

Cevelop is an integrated development environment (IDE) for C and C++ projects based on the Eclipse platform. It provides advanced code assistance and refactoring tools tailored for C++ development.

Categories:
c ide eclipse code-assistance refactoring

Cevelop Features

  1. Code completion
  2. Refactoring
  3. Debugging
  4. Project management
  5. Version control integration
  6. Code analysis

Pricing

  • One-time Purchase
  • Subscription-Based

Pros

Good C++ support

Fast and responsive interface

Helpful code assistance

Integration with CMake and other tools

Cons

Limited community and support compared to bigger IDEs

Fewer plugins than Eclipse

May lack some advanced features of Visual Studio


WinDbg

WinDbg

WinDbg is a powerful Windows debugging tool used mainly for analyzing crashes and errors in Windows applications and drivers. It provides detailed assembly-level debugging and can be used to inspect live programs or crash dumps.

Categories:
debugger windows crash-analysis assembly-debugging

WinDbg Features

  1. Assembly-level debugging
  2. Memory inspection
  3. Call stack tracing
  4. Breakpoint setting
  5. Watch variable tracking
  6. Dump file analysis

Pricing

  • Free
  • Open Source

Pros

Powerful low-level debugging

Integrated with Visual Studio

Can debug user and kernel mode

Rich set of commands

Free and included with Windows SDK

Cons

Steep learning curve

Command line interface only

Difficult for beginners

Limited documentation and support