BTMetrics
Description: BTMetrics is a business intelligence and data analytics platform designed for small and medium-sized businesses. It provides easy-to-use tools for data visualization, reporting, and building dashboards to gain insights from company data.
Type: software
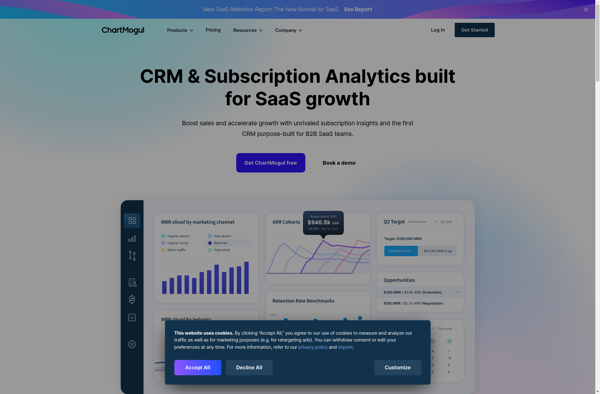
ChartMogul
Description: ChartMogul is a subscription analytics platform that helps businesses track key metrics around recurring revenue, customer churn, MRR, and more. It integrates with billing systems like Stripe and Chargify to automatically pull in subscription data.
Type: software
Pricing: Subscription