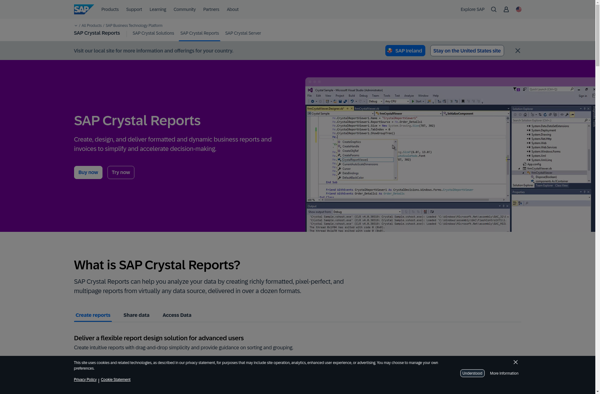
Struggling to choose between DrillDb and Crystal Reports? Both products offer unique advantages, making it a tough decision.
DrillDb is a Ai Tools & Services solution with tags like sql, nosql, big-data, analytics.
It boasts features such as Supports SQL queries on NoSQL and distributed file systems, Massively parallel processing for fast query performance, Plugin architecture to connect to different data sources, Support for Hadoop, MongoDB, HBase, HDFS, MapR-DB, Amazon S3, Interactive SQL shell and JDBC/ODBC drivers, In-memory caching for repeated queries, Columnar storage for analytics, Cost based optimizer, Visualization with tools like Tableau and pros including Makes working with NoSQL and big data easier with familiar SQL syntax, Fast query performance on large datasets, Connects to many popular big data sources, Open source and free to use, Can scale to large clusters and petabytes of data.
On the other hand, Crystal Reports is a Business & Commerce product tagged with reporting, business-intelligence, data-visualization.
Its standout features include Report design and generation, Connectivity to various data sources, Formatting and visualization options, Ad hoc reporting, Scheduled report distribution, and it shines with pros like Powerful and flexible report designer, Supports connections to many data sources, Interactive and visually appealing reports, Can be embedded into other apps.
To help you make an informed decision, we've compiled a comprehensive comparison of these two products, delving into their features, pros, cons, pricing, and more. Get ready to explore the nuances that set them apart and determine which one is the perfect fit for your requirements.
DrillDb is an open-source SQL query engine for big data that supports querying a variety of NoSQL databases and file systems. It allows users to analyze large datasets without requiring them to structure the data upfront.
Crystal Reports is a business intelligence application used to design and generate reports from a wide range of data sources. It allows users to analyze data and create rich, interactive reports with graphs, charts, and visualizations.