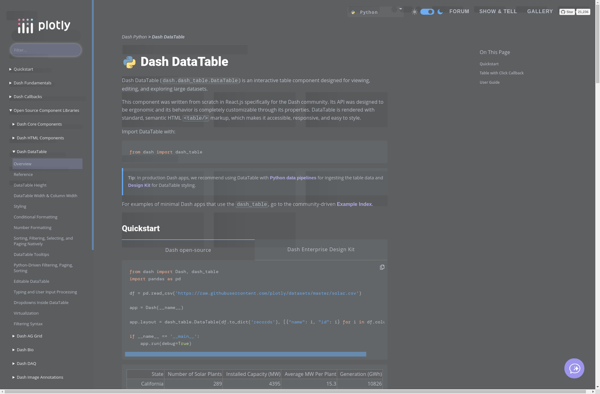
Dash DataTable
Description: Dash DataTable is an open-source Python library for building interactive data tables. It allows for filtering, sorting, pagination, editing, selecting rows, exporting, and more. Dash DataTable makes it easy to display large, dynamic datasets.
Type: software
Pricing: Open Source
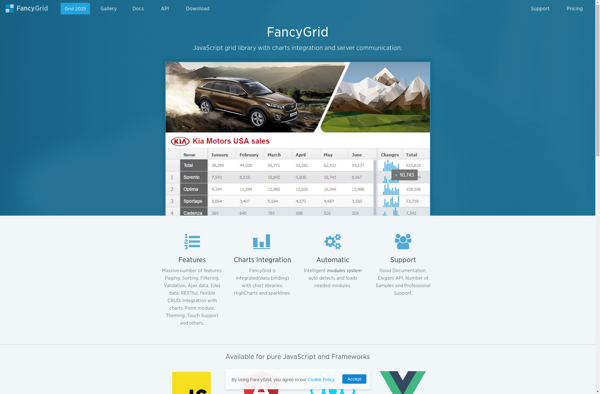
FancyGrid
Description: FancyGrid is a user-friendly spreadsheet and data visualization software. It allows fast and intuitive data analysis, charting, dashboarding, and data management with collaboration features.
Type: software