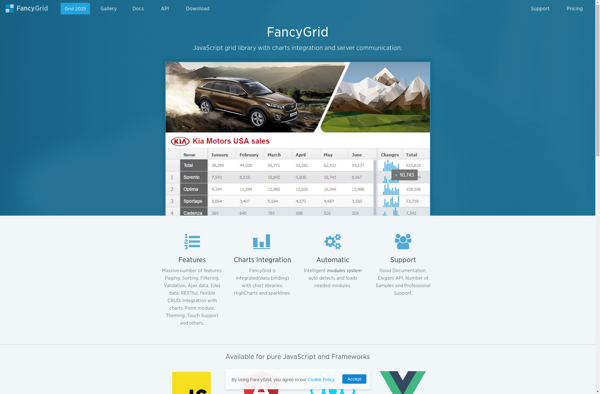
FancyGrid
FancyGrid is a user-friendly spreadsheet and data visualization software. It allows fast and intuitive data analysis, charting, dashboarding, and data management with collaboration features.
FancyGrid: User-Friendly Spreadsheet & Data Visualization Software
FancyGrid is a user-friendly spreadsheet and data visualization software. It allows fast and intuitive data analysis, charting, dashboarding, and data management with collaboration features.
What is FancyGrid?
FancyGrid is a powerful yet easy-to-use spreadsheet software and data visualization tool for analyzing, visualizing and sharing data. It provides a variety of features:
- User-friendly spreadsheet interface for entering, formatting and calculating data.
- Hundreds of charts and graph types to visualize data, reveal patterns and turn numbers into actionable insights.
- Interactive dashboards to combine visuals, spreadsheets and narratives for data storytelling.
- Real-time collaboration allowing multiple users to simultaneously edit spreadsheets.
- Data management capabilities like connecting to databases and preparing data for analysis.
- Advanced analytical features like statistical analysis, forecasting, what-if analysis and more.
With its intuitive interface, smooth performance and comprehensive analytical toolset, FancyGrid enables users of all skill levels to unlock deep insights from their data for better and faster decision making.
FancyGrid Features
Features
- Spreadsheet interface
- Charting and data visualization
- Dashboard creation
- Collaboration tools
- Data management
- Powerful formulas
- Pivot tables
- Keyboard shortcuts
- Customizable themes
- Add-ons and integrations
Pricing
- Freemium
- Subscription-Based
Pros
User-friendly and intuitive
Fast data analysis
Powerful features
Collaboration capabilities
Cross-platform availability
Cons
Steep learning curve for advanced features
Limited free version
Can be resource intensive for large datasets
Official Links
Reviews & Ratings
Login to ReviewThe Best FancyGrid Alternatives
View all FancyGrid alternatives with detailed comparison →
Top Office & Productivity and Spreadsheets and other similar apps like FancyGrid
Here are some alternatives to FancyGrid:
Suggest an alternative ❐Airtable
Airtable is a cloud-based database and spreadsheet application that provides users with an intuitive way to organize, edit, and share data across teams. It combines the flexibility of a database with the visual interface of a spreadsheet.Some key features of Airtable include:Intuitive drag-and-drop interface to structure databasesAbility to view data...

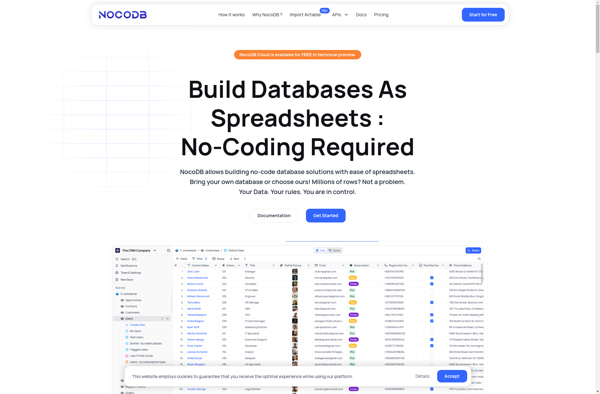
NocoDB
NocoDB is an open-source alternative to Airtable that allows users to create databases and tables without needing coding knowledge. It has an intuitive, spreadsheet-style interface that makes it easy for anyone to set up a database in minutes.Some key features of NocoDB include:Creating tables with different column types like text,...
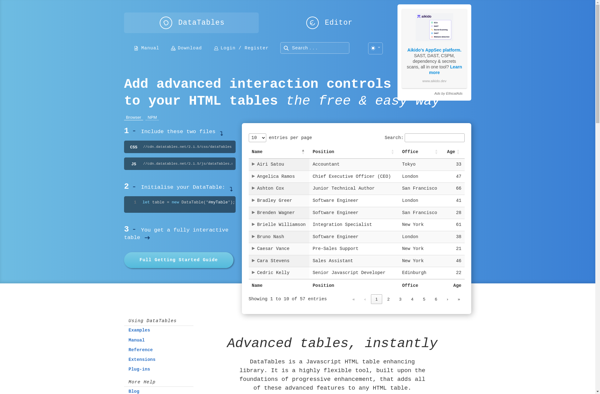
DataTables
DataTables is an open source jQuery plugin that enhances the functionality and interactivity of HTML tables. It provides features like searching, sorting, filtering, and pagination that make large data sets in tables more manageable and user-friendly.Some key features of DataTables include:Search box - Allows users to quickly search for data...
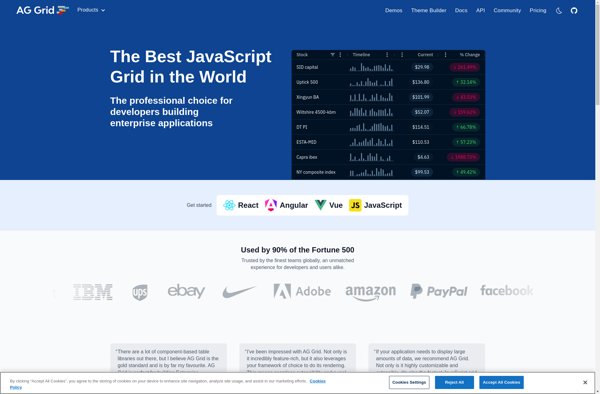
Ag-Grid
ag-Grid is an advanced JavaScript data grid component built for high performance enterprise applications. Key capabilities and benefits include:Rich in-cell editing - allow users to edit data directly in the gridCustomizable cell rendering - full control over how data is displayed in cellsColumn grouping & aggregation - group and aggregate...
Highcharts
Highcharts is an advanced JavaScript charting library used to visualize data and create interactive charts and graphs in web applications. Originally developed in 2009 by Highsoft AS, Highcharts allows developers to quickly add charts and graphs to their web pages with support for a wide variety of chart types out...

DHTMLX
DHTMLX is a comprehensive JavaScript library for building modern web applications. It includes a wide range of reusable user interface components, data visualization widgets, and utilities to speed up development.Some of the key features of DHTMLX:Over 60 ready-to-use UI widgets including grids, forms, charts, calendars, trees, editors, and more.Adaptive UI...

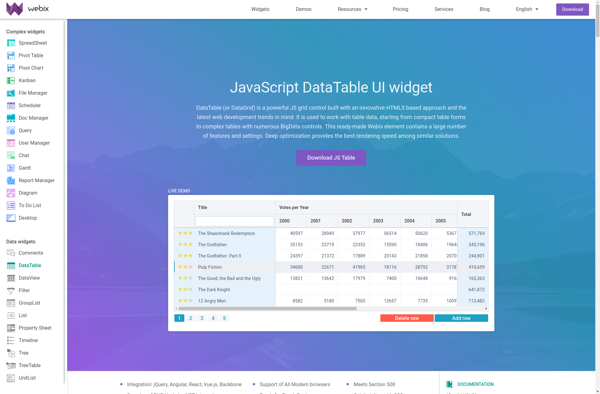
Webix DataTable
Webix DataTable is a feature-rich JavaScript grid (table) component for displaying, manipulating, and working with tabular data. It is part of the Webix UI library.Key features of Webix DataTable include:Displaying data from local datasets, JSON, XML, CSV files, or remote data via APISorting, filtering, paging for efficient data manipulationInline and...
D3.js
D3.js, or D3, is an open-source JavaScript library used for visualizing data with web standards. D3 stands for Data-Driven Documents. It allows developers to bind arbitrary data to the Document Object Model (DOM) and then apply data-driven transformations to the document. This allows web developers to create dynamic, interactive data...

JQuery UI
jQuery UI is a lightweight, customizable, cross-browser JavaScript library of user interface interactions, effects, widgets, and themes. It is designed to work seamlessly with jQuery, making web development faster and easier.Some of the key features of jQuery UI include:Interactions - Draggable, Droppable, Resizable, Selectable, Sortable and more for building highly...

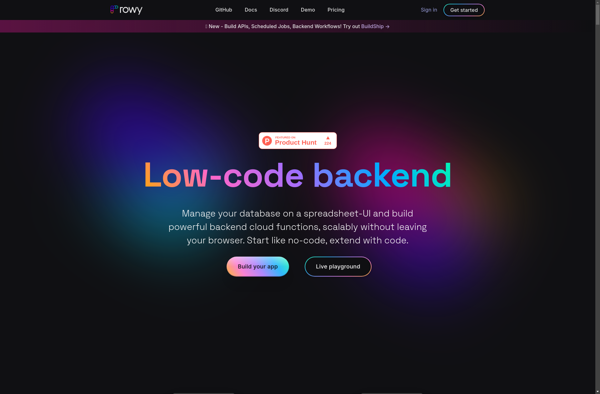
Rowy
Rowy is a unique spreadsheet and database software that combines the flexibility of spreadsheets with the structure of databases. It gives users the ability to build customized tables, forms, and views to manage their data, without needing any coding or prior technical expertise.Some key features of Rowy include:Intuitive drag-and-drop interface...
Ext JS
Ext JS is a feature-rich JavaScript framework for building data-intensive, cross-platform web applications. Originally developed by Sencha, Ext JS provides a library of pre-built UI components and supports MVC architecture out of the box.Some key features of Ext JS include:Large collection of customizable and themeable UI components like grids, trees,...

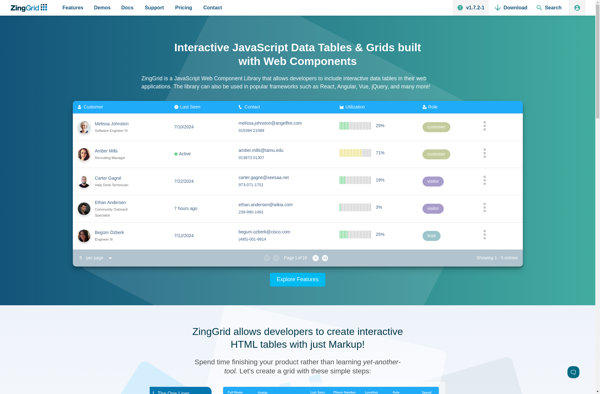
ZingGrid
ZingGrid is an open-source JavaScript data grid library designed for building interactive data tables and grids for web applications. Here are some key details about ZingGrid:Lightweight codebase that is easy to integrate into new or existing projectsIntuitive API for binding data, handling events, customizing appearanceFamiliar spreadsheet-style features like sorting, filtering,...
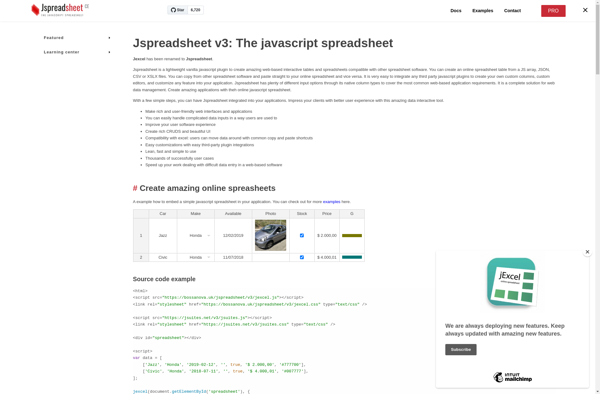
JExcel
jExcel is a lightweight open-source JavaScript spreadsheet library that allows developers to add Excel-like tables and spreadsheets to their web applications. It provides an easy way to manage tabular data and perform calculations and data transformations without requiring any server-side scripts.With jExcel, you can enable features typically found in desktop...
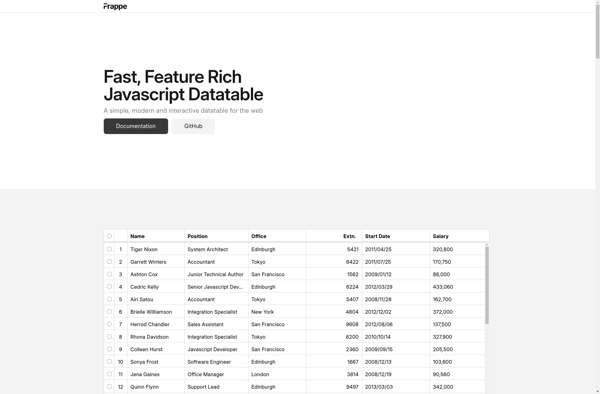
Frappe DataTable
Frappe DataTable is an open-source JavaScript library for building interactive data tables for web applications. It is designed to be a highly customizable and full-featured library for displaying tabular data.Some key features of Frappe DataTable include:Sorting - Allow tables to be sorted by one or more columns in ascending or...
List.js
List.js is a lightweight open-source JavaScript library for adding search, sort, filters and flexibility to tables, lists and various HTML elements. Developed by Jonny Strömberg, List.js aims to handle large data sets and complex data without getting bogged down.Some key features of List.js include:Search - Quickly filter table content with...

FooTable
FooTable is a lightweight open-source jQuery plugin that makes HTML tables responsive and enables additional functionality. It allows tables to be easily viewed and navigated on all devices and screen sizes by dynamically hiding columns and adding useful features.When the screen size is too small to display the entire table,...

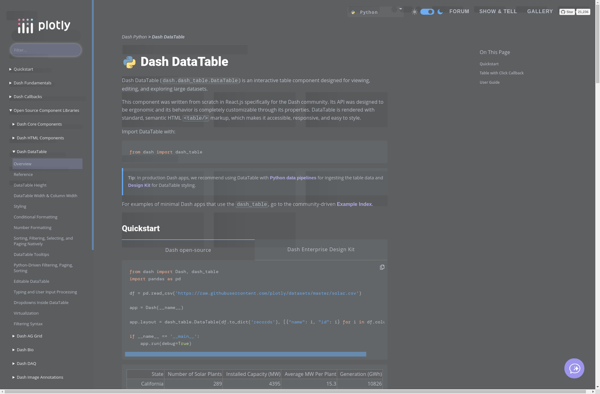
Dash DataTable
Dash DataTable is an open-source Python library for building interactive data tables and grids. It is part of the Plotly Dash library for building analytical web applications. Dash DataTable allows you to render large, dynamic datasets with full filtering, sorting, pagination, editing, selecting, and exporting capabilities.Some key features of Dash...
JQuery Dynatable
jQuery Dynatable is a lightweight JavaScript library that allows you to easily add advanced interaction controls to HTML tables, including sort, search, paginate, and filter. It works by transforming existing static HTML tables into dynamic and interactive tables.Some key features of Dynatable include:Sorting - Allow table sorting by one or...

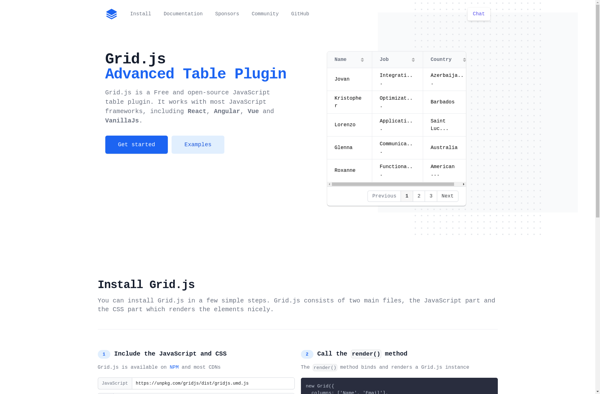
Grid.js
Grid.js is an open-source JavaScript data grid library developed by Afshin Mehrabani. It is designed to provide an easy way to display tabular data with rich features. Some key things to know about Grid.js:Lightweight - It has no external dependencies and aims to offer excellent performance.Mobile-friendly - It works smoothly...
Vanilla-DataTables
Vanilla-DataTables is an open source JavaScript library built on top of vanilla JavaScript that adds advanced interaction controls and features to plain HTML tables. Some of the key features it provides include:Searchable tables - Users can search for specific data across all columnsSortable columns - Columns can be configured to...
