Highcharts

Highcharts: Interactive Charting Library
Highcharts is a JavaScript charting library that allows developers to easily create interactive charts and graphs. It supports a wide variety of chart types including line, area, column, pie, and more. Highcharts is customizable, responsive, supports animation, and has rich documentation and examples.
What is Highcharts?
Highcharts is an advanced JavaScript charting library used to visualize data and create interactive charts and graphs in web applications. Originally developed in 2009 by Highsoft AS, Highcharts allows developers to quickly add charts and graphs to their web pages with support for a wide variety of chart types out of the box, including line, spline, area, areaspline, column, bar, pie, scatter, angular gauges, arearange, areasplinerange, columnrange, bubble, box plot, error bars, funnel, waterfall and polar chart types.
Some key features and capabilities include:
- Interactive charts with hover and click events, animations, and rich tooltip formatting
- Client-side chart rendering with SVG and VML support for older browsers
- Adaptive responsive design and automatic resizing
- Date axes with customizable formatting and date navigation
- Drill down and select points to expose underlying data
- Live data updates to charts with real-time streaming
- Tree map, network graph, word cloud, heat map, and other special chart types
- 3D chart options including globes and mapped 3D scatter plots
- Statistical operations like regression lines, sampling, and averaging
- Robust API to customize almost every aspect of appearance and behavior
Highcharts includes dozens of customizable themes and is designed to integrate easily with popular JavaScript frameworks like React, Angular, and Vue. There is a Highcharts CDN available for serving the library quickly, and detailed documentation with hundreds of code samples and customizable demos to accelerate development. Both open source and commercial license options are available.
Highcharts Features
Features
- Interactive JavaScript charts
- Supports wide variety of chart types
- Highly customizable
- Responsive design
- Animation and interactive features
- Rich documentation and examples
Pricing
- Free
- Open Source
- Commercial License
Pros
Cons
Official Links
Reviews & Ratings
Login to ReviewThe Best Highcharts Alternatives
View all Highcharts alternatives with detailed comparison →
Top Development and Data Visualization and other similar apps like Highcharts
Here are some alternatives to Highcharts:
Suggest an alternative ❐Google Charts

Plotly

CanvasJS Charts

Datamatic.io

ChartBlocks

AmCharts

D3.js

C3.js

Open Flash Chart

NVD3

Dc.js

Bokeh

ZoomCharts

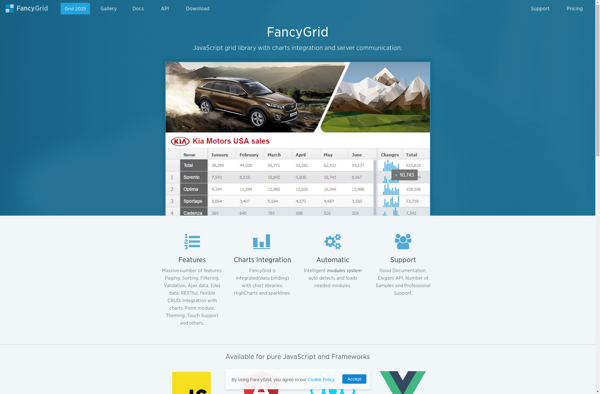
FancyGrid
Picasso.js

Vis.js

Charts 4 PHP

LiveGap Charts

Smoothie Charts

Morris.js

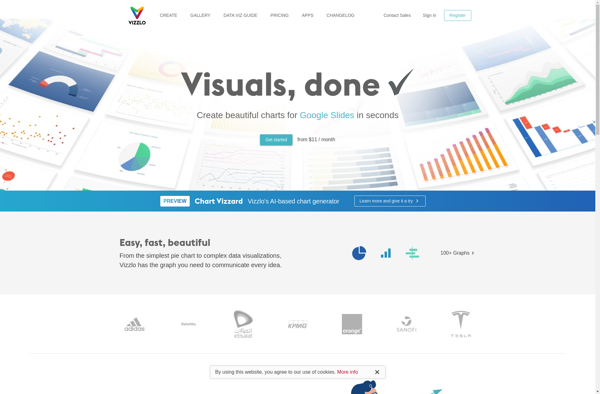
Vizzlo
RGraph

UvCharts

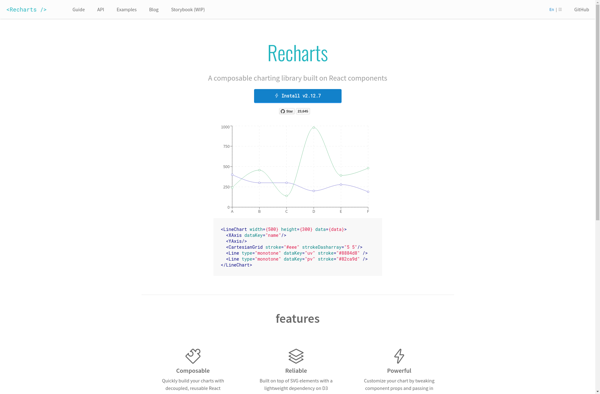
Recharts
RAWGraphs

Chartkick

JqPlot

Epoch Charting Library

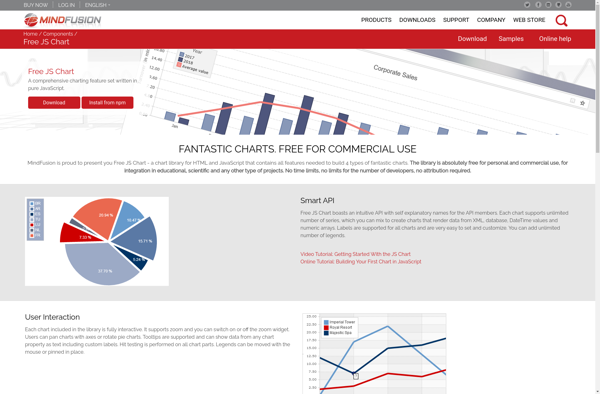
Free JS Chart
Ember Charts

ArcadiaCharts
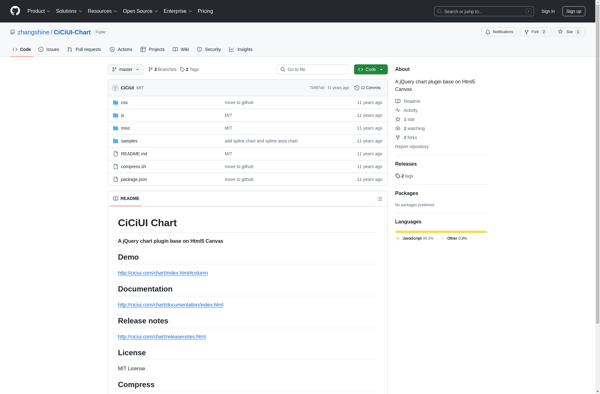
CiCiUI Chart
Create a chart online
Chart Templates

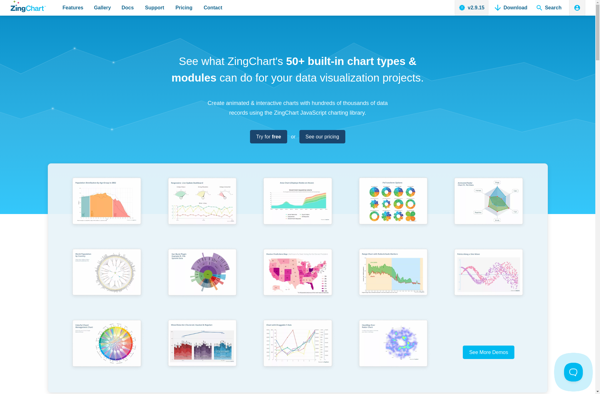
ZingChart
N3-charts

AnyChart

PykCharts.js
EJSCharts

CanvasXpress
