Bokeh is an interactive data visualization library for Python that targets modern web browsers for presentation. It offers elegant, concise construction of versatile graphics, and affords high-performance interactivity over large or streaming datasets.
Bokeh is an interactive data visualization library for Python that targets modern web browsers for presentation. It offers elegant, concise construction of versatile graphics, and affords high-performance interactivity over large or streaming datasets.
What is Bokeh?
Bokeh is an open-source Python library for creating interactive data visualizations for modern web browsers. It allows users to quickly construct versatile and high-performance graphics from simple plots to complex dashboards. Some key features of Bokeh include:
Integration with common Python data science libraries like NumPy, Pandas, Scikit-Learn for easy data analysis and manipulation
A clean, elegant syntax focused on clarity and simplicity
The ability to add rich, dynamic, user-driven interactivity to visualizations like hovering, panning, zooming etc.
Support for streaming large datasets to power real-time dashboards
Flexible output options - can generate standalone HTML/JavaScript files or interactive Jupyter notebook widgets
Style customization through themes and templates
Built-in widgets and tools for adding UI elements like sliders, dropdowns etc.
Overall, Bokeh strikes a good balance between simplicity, customizability and performance for web-based visualization needs ranging from exploratory analysis to production dashboards.
Bokeh Features
Features
Interactive data visualization
Supports streaming data
Python library
Targets modern web browsers
Elegant and concise graphics
High-performance interactivity
Can handle large datasets
Pricing
Open Source
Pros
Very flexible and customizable visualizations
Integrates well with other Python data tools like NumPy and Pandas
Open source and free
Good performance even with large datasets
Nice web-based interface for sharing visualizations
Cons
Steeper learning curve than some visualization libraries
Visualizations can be more complex to build
Limited built-in statistical analysis features
Requires knowledge of Python and web development
Not as simple as drag-and-drop visualization builders
OriginPro is a powerful data analysis and graphing software designed for scientists, engineers, and analysts across various industries. It is developed by OriginLab Corporation for analyzing, graphing, and presenting scientific data.Some of the key features of OriginPro include:An extensive selection of analysis tools like peak analysis, surface fitting, statistics, signal...
Desmos is an online graphing calculator and geometry tool used by students, teachers, and professionals in math, science, engineering, business, and more. It allows users to quickly visualize mathematical functions, equations, inequalities, and data sets with an easy-to-use web interface and mobile apps for iOS and Android.Key features of Desmos...
Google Charts is a robust and flexible JavaScript charting and data visualization library provided for free by Google. It offers developers a highly customizable way to create interactive charts, graphs, and data tables that seamlessly integrate into web pages and applications.With Google Charts, you can visualize complex data sets and...
Plotly is an open-source graphing library that allows users to create interactive, publication-quality graphs, charts, and dashboards. It supports Python, R, JavaScript, and Excel as programming languages. Some key features of Plotly include:Interactive visualization - Plotly charts are interactive with features like hover text, zooming, panning, selectable legends, and editable...
Highcharts is an advanced JavaScript charting library used to visualize data and create interactive charts and graphs in web applications. Originally developed in 2009 by Highsoft AS, Highcharts allows developers to quickly add charts and graphs to their web pages with support for a wide variety of chart types out...
CanvasJS Charts is a feature-rich JavaScript HTML5 charting library that enables interactive charts, graphs and data visualizations in web applications and sites. It is free for non-commercial use and offers over 30 different chart types including line, area, column, bar, pie, doughnut, funnel, polar, radar, range and more.Some key features...
ChartBlocks is a business intelligence and data visualization software used to create interactive charts, dashboards, and reports for better data analysis. It provides an easy drag-and-drop interface to build visualizations quickly without the need for coding.Some key features of ChartBlocks include:Drag-and-drop functionality to create various charts like bar, line, pie,...
D3.js, or D3, is an open-source JavaScript library used for visualizing data with web standards. D3 stands for Data-Driven Documents. It allows developers to bind arbitrary data to the Document Object Model (DOM) and then apply data-driven transformations to the document. This allows web developers to create dynamic, interactive data...
C3.js is an open-source JavaScript library for generating clear and attractive charts. It is a wrapper built on top of D3.js that simplifies common chart types like line, bar, pie, scatter, stacked graphs, etc. The goal is to provide an easy way for web developers to visualize data without writing...
Open Flash Chart is an open-source JavaScript charting library used to create interactive Flash-based charts for web applications. It provides an easy way for developers to add advanced data visualizations and graphs to their websites without needing to write Flash code.Some key features of Open Flash Chart include:Support for various...
NVD3 is an open-source JavaScript charting library used to build interactive data visualizations in web browsers. It is based on D3.js and reuses parts of the D3 codebase to create reusable charts. NVD3 aims to simplify and streamline D3 code for faster web development.Some key features of NVD3 include:Over a...
dc.js is a JavaScript charting library that leverages d3.js and crossfilter for interactive dimensional charting and visual analysis of large datasets. Some key features of dc.js include:Integration with d3.js for powerful and flexible visualizationsTight integration with crossfilter for fast filtering and grouping of large datasetsFocus+Context and Brushing chart interactionsAnimated transitions...
ZoomCharts is a feature-rich JavaScript charting library used to create interactive data visualizations for web applications and dashboards. With over 90 chart types to choose from, including line, bar, pie, map, scatter, and more, ZoomCharts provides the flexibility to represent data in a meaningful way.Some of the key capabilities and...
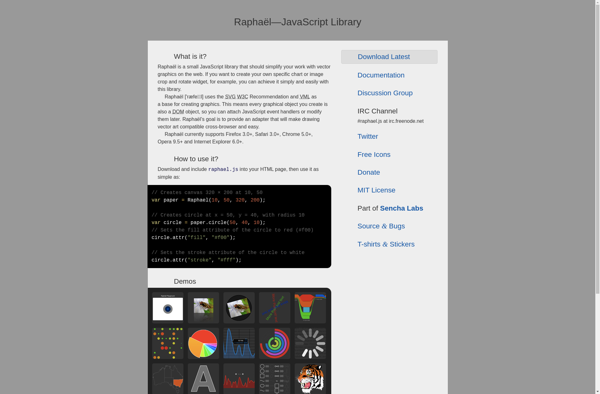
Raphaël is a JavaScript library that focuses on providing an easy way for web developers to incorporate vector graphics, visualization, and animation into their web pages and applications. It is designed to provide a single API that works consistently across all major browsers, both modern and legacy.Raphaël uses either SVG...
Vis.js is an open source data visualization library built with JavaScript. It allows developers to create interactive visualizations such as timelines, networks and graphs easily in the browser using web standards.Some of the key features of Vis.js include:Various data visualization modules for timelines, networks, graphs etc.Easily customizable and extensible to...
Charts 4 PHP is an open-source and free PHP charting library that allows developers to create interactive charts, graphs and data visualizations using PHP. It provides an easy way to visualize data on web applications and sites built with PHP.Some key features of Charts 4 PHP:Supports various chart types including...
Vega-Lite is a high-level visualization grammar built on top of the Vega visualization grammar. It provides a concise, human-readable JSON syntax for creating visualizations by specifying mappings from data fields to visual channels such as x, y, color, and size.Some key capabilities and benefits of Vega-Lite include:Rapid generation of visualizations...
Matplotlib is a comprehensive 2D plotting library for Python that enables users to create a wide variety of publication-quality graphs, charts, and visualizations. It supports many basic and advanced plotting functionalities and integrates well with NumPy and Pandas data structures.Matplotlib can be used to visualize data in a variety of...
Smoothie Charts is an open-source JavaScript charting library designed specifically for real-time streaming data visualization. Some key features include:Optimized for line, bar, scatter, spline, and area graphs using canvasFast animation with a small code footprint suitable for embedded devicesHandles large volumes of real-time data without dropping framesCustomizable scales, interpolation modes,...
Stagraph is a powerful yet easy-to-use data visualization and analytics platform designed for modern business needs. As a cloud-based solution, Stagraph enables users to effortlessly map, analyze, and gain actionable insights from even the most complex data sets through intuitive drag-and-drop visualizations.Key capabilities and benefits include:Intelligible and interactive data visualizations...
RGraph is an open source JavaScript charting library that allows developers to add interactive, customizable charts and graphs to web pages without needing a charting server backend. It is lightweight, easy to implement, and supports over 30 chart types including line, bar, pie, scatter, waterfall, funnel charts and more.Some key...
uvCharts is an open-source JavaScript charting library for building interactive data visualizations for the web. Some key features and benefits of uvCharts include:Open source and completely free to useLightweight at only 15kB gzippedSupports a wide variety of chart types including line, bar, pie, scatter, area charts and moreExtensive customization options...
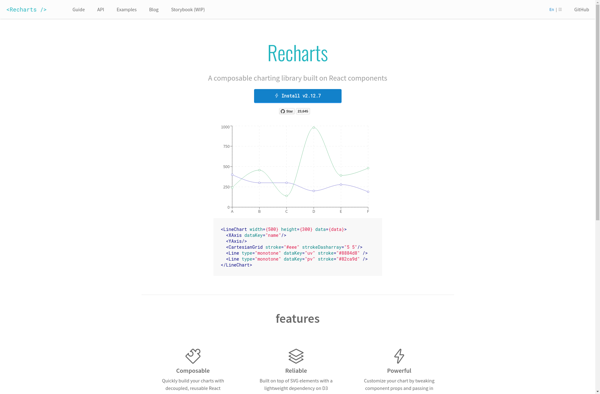
Recharts is an open-source React charting library used to build various data visualizations and interactive charts. It is Declarative, Component-Based, and highly customizable to create charts such as line, bar, pie, radar, scatter, treemap and more.Some key features of Recharts:Supports both SVG and Canvas rendering using a unified APIResponsive design...
RAWGraphs is a free, open-source web tool created for anyone to easily visualize and share data using the most common graphical formats. The simple drag and drop interface makes it easy for non-experts to quickly generate a wide variety of charts and diagrams that can be exported and shared as...
Chartkick is an open-source charting library for Ruby on Rails applications. It provides a simple domain-specific language for generating interactive charts and graphs without writing any JavaScript. Chartkick supports various chart types like line charts, pie charts, column charts, bar charts and more.Some key features of Chartkick:Easy integration into Rails...
The Epoch Charting Library is an open-source JavaScript charting library designed for building a wide range of interactive browser-based data visualizations. It provides a simple yet powerful API for defining chart types like bar charts, line charts, scatter plots, pie charts, area plots, and more. The library handles details like...
Ember Charts is an open-source JavaScript charting library built for use in Ember.js applications. It provides a set of reusable Ember components and services to help developers quickly add beautiful, interactive charts and graphs to their apps.Key features of Ember Charts include:Tight integration with Ember's data layer - easily bind...
ArcadiaCharts is an open-source JavaScript charting library for building interactive data visualizations for the web. With ArcadiaCharts, you can create various types of charts like line charts, bar charts, pie charts, scatter plots, area charts, and more.Some key features and capabilities of ArcadiaCharts include:Support for animation and transitions for more...
ggvis is an R package developed by RStudio for building interactive data visualizations. It allows users to create rich graphics and plots that can be embedded in web pages and applications. Some key features of ggvis include:Builds on the popular ggplot2 graphics package in R, so it is easy for...
n3-charts is a feature-rich JavaScript charting library for adding interactive data visualizations to web apps and sites. Developed with focus on performance, customizability and ease-of-use, n3-charts allows developers to quickly build various types of charts and graphs to effectively visualize data.With n3-charts, you can create line, bar, column, area, pie,...
AnyChart is a feature-rich JavaScript charting library that enables developers to easily add interactive charts and dashboards to web and mobile applications. With its lightweight architecture, AnyChart aims to provide high performance chart rendering optimized even for large datasets.AnyChart supports over 80 chart types including column, bar, line, area, pie,...
PykCharts.js is an open source JavaScript charting library for building highly customizable and interactive data visualizations and charts using web technologies. It is built on top of the popular D3.js library.Key features of PykCharts include:Support for various chart types like line, bar, pie, donut, scatter, bubble maps etc.Interactive charts with...
EJSCharts is a flexible JavaScript charting library for adding interactive charts and graphs to web applications and sites. It is built on top of the EJ2 JavaScript library and integrates seamlessly with other Syncfusion UI components.With EJSCharts, you can create over 35 chart types including line, area, bar, pie, doughnut,...
CanvasXpress is an open-source JavaScript data visualization library designed for interactive data graphing and analysis. It allows researchers and developers to create a wide variety of highly customizable data visualizations including bar charts, pie charts, dot plots, heatmaps, scatter plots, box plots, histograms, line plots, network diagrams and more.Some key...