ChartBlocks

ChartBlocks: Data Visualization and Business Intelligence Softwares
Discover ChartBlocks, a powerful data visualization and business intelligence tool for creating interactive charts, dashboards, and reports with drag-and-drop functionality, no coding required.
What is ChartBlocks?
ChartBlocks is a business intelligence and data visualization software used to create interactive charts, dashboards, and reports for better data analysis. It provides an easy drag-and-drop interface to build visualizations quickly without the need for coding.
Some key features of ChartBlocks include:
- Drag-and-drop functionality to create various charts like bar, line, pie, scatter plots etc.
- Options to add dynamic filters, slicers, scrolling, and other interactions
- Collaboration tools to share dashboards and visualizations
- Auto-refresh of visualizations when data gets updated
- Connections to data sources like SQL, MySQL, Postgre, Salesforce etc.
- Options to schedule and email reports
- Exporting of dashboards and underlying data
- Role-based access control for managing permissions
With its user-friendly and customizable interface, ChartBlocks is used by businesses of all sizes to visualize data for gaining better insights. The software does not require knowledge of coding or any prior BI experience.
ChartBlocks Features
Features
- Drag-and-drop interface to create charts/dashboards
- Prebuilt chart templates
- Connect to data sources like Excel, SQL databases
- Collaboration tools to share dashboards
- Scheduled report generation and distribution
- Mobile optimization of dashboards
- Customizable themes and branding
- Integration with other apps via API
Pricing
- Freemium
- Subscription-Based
Pros
Cons
Official Links
Reviews & Ratings
Login to ReviewThe Best ChartBlocks Alternatives
Top Office & Productivity and Data Visualization and other similar apps like ChartBlocks
Here are some alternatives to ChartBlocks:
Suggest an alternative ❐Google Charts

Plotly

Highcharts

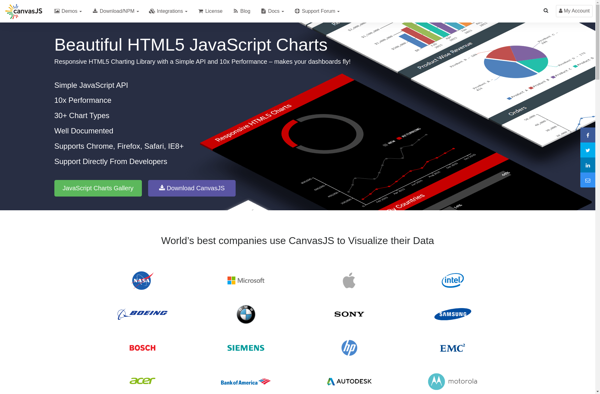
CanvasJS Charts
Visuafy
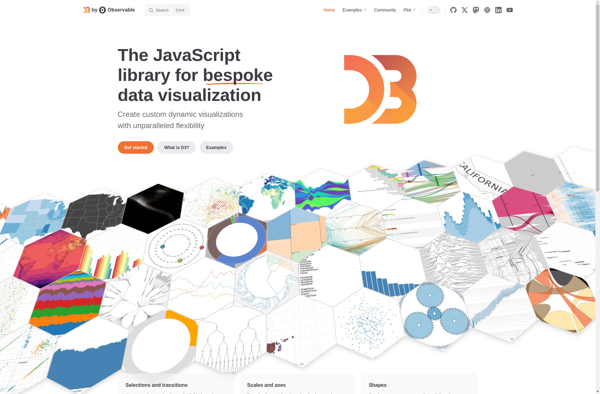
D3.js
NVD3

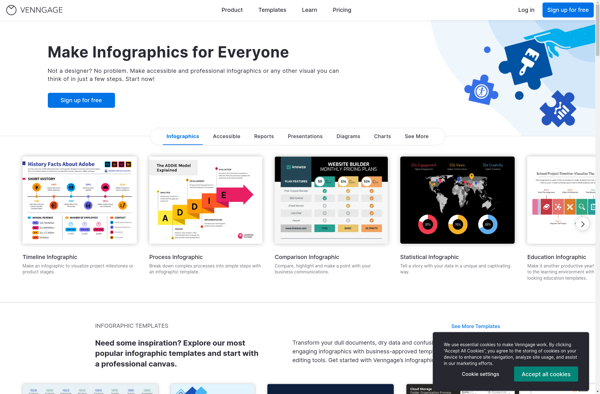
Venngage
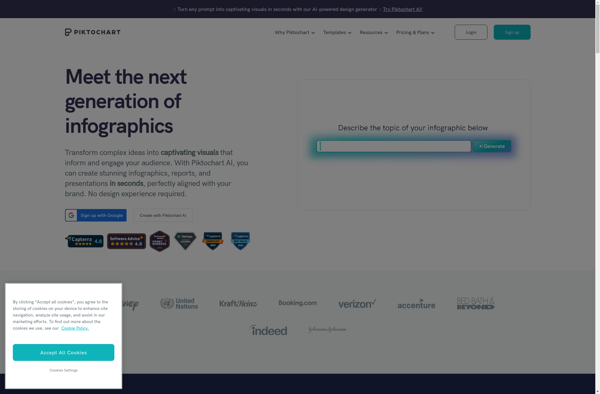
Piktochart
Bokeh

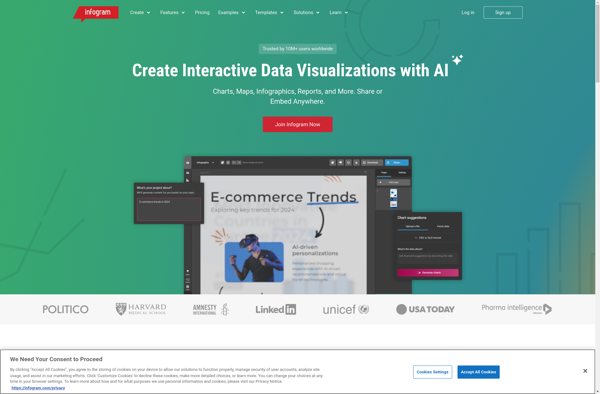
Infogr.am
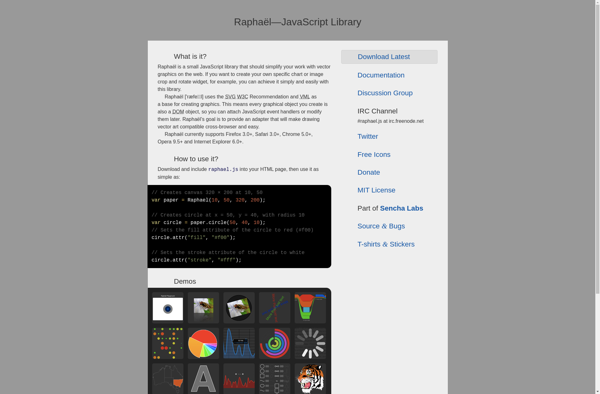
Raphaël
Easel.ly

Vis.js

RAWGraphs

Atlas charts
Statpedia
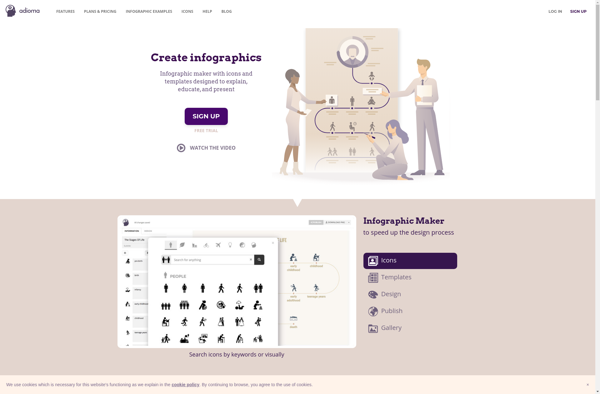
Adioma
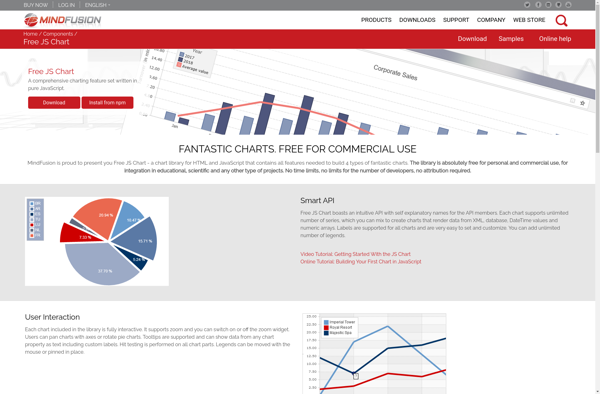
Free JS Chart
Ggvis

Chartico
Create a chart online
Charte.ca
