Piktochart
Piktochart is an easy-to-use graphic design software that allows users to quickly create stunning infographics, presentations, posters, and more. It has a drag-and-drop interface, pre-made templates, and integrations with other applications.
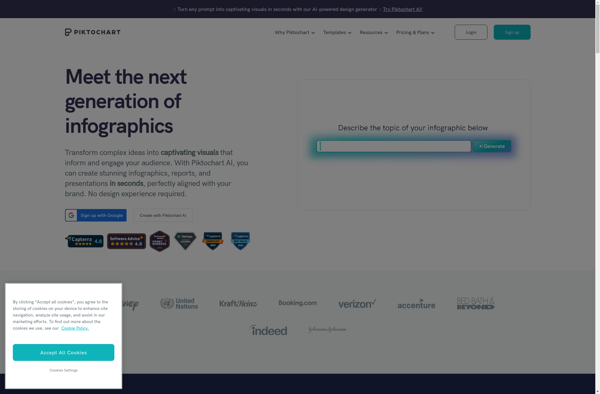
Piktochart: Easy Graphic Design Software for Stunning Infographics
Create professional-looking infographics, presentations, posters & more with Piktochart's intuitive drag-and-drop editor, pre-made templates & seamless integrations.
What is Piktochart?
Piktochart is a web-based graphic design application that makes it simple for non-designers to create professional-looking visual content. Some key features of Piktochart include:
- Drag-and-drop interface - Easy to use even for those with no design experience
- Hundreds of templates - Choose from infographics, posters, presentations, social media graphics, and more
- Icons, images, and illustrations - Massive library of visual assets to decorate designs
- Color schemes and themes - Provides cohesive palettes and styles for graphics
- Animation effects - Make infographics and presentations more engaging
- Real-time collaboration - Work on designs together with remote teams
- Integrations - Connects with applications like Google Sheets, Dropbox, and Canva
- Brand kit - Customize charts, logos, fonts, and colors for branded designs
- Social media exporter - Optimizes graphics for different social platforms
With an extensive template library and powerful customization options, Piktochart makes it possible for anyone to create professional visual content, even without artistic skills or design training.
Piktochart Features
Features
- Drag-and-drop interface
- Pre-made templates
- Integrations with other applications
- Ability to create infographics, presentations, posters, and more
- Custom branding and design options
- Collaboration and sharing features
- Analytics and reporting tools
Pricing
- Freemium
- Subscription-Based
Pros
Easy to use
Comprehensive design tools
Affordable pricing options
Variety of templates and design elements
Collaborative features
Cons
Limited free plan features
Some design options may be limited compared to more advanced design software
Learning curve for more complex features
Official Links
Reviews & Ratings
Login to ReviewThe Best Piktochart Alternatives
Top Office & Productivity and Presentation Software and other similar apps like Piktochart
Here are some alternatives to Piktochart:
Suggest an alternative ❐Datamatic.io
Datamatic.io is a cloud-based no-code data pipeline platform that allows users to build data integration, transformation, and loading processes without needing to write any code. Some key features of Datamatic.io include:Graphical interface to visually design data pipelines by connecting various pre-built data source and destination connectors as well as transformation...

ChartBlocks
ChartBlocks is a business intelligence and data visualization software used to create interactive charts, dashboards, and reports for better data analysis. It provides an easy drag-and-drop interface to build visualizations quickly without the need for coding.Some key features of ChartBlocks include:Drag-and-drop functionality to create various charts like bar, line, pie,...

Many Eyes
Many Eyes is a public web application launched in 2007 by IBM Research for visualizing data and creating interactive visualizations. It allows users to upload datasets in various formats, create visualizations like charts, graphs, maps, networks and trees based on the data, and publish them for public viewing and analysis.Some...
Venngage
Venngage is a leading visual content creation platform used by individuals and teams to create impactful infographics, presentations, flyers, reports and other visual content. It provides an easy-to-use online editor that allows users to visually create professional graphics and documents in just a few clicks.With Venngage's drag-and-drop interface, users can...
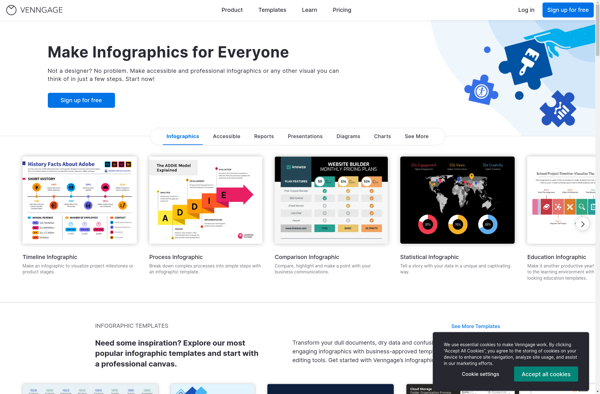
Infogr.am
Infogr.am is a user-friendly infographic and data visualization creation software. With an easy drag-and-drop interface, it enables anyone to create sleek, interactive infographics, charts, maps and dashboards in just minutes without coding.Some key features of Infogr.am:Large library of charts and graphs (bar, pie, line, area, scatterplots etc.) to visualize dataInteractive...
Easel.ly
easel.ly is an online infographic creation application that makes it simple for anyone to create visually appealing infographics even if they don't have design experience. It provides a drag-and-drop interface along with a large library of templates, shapes, icons, themes, and color schemes that allow users to put together professional-looking...
Vizzlo
Vizzlo is an easy-to-use data visualization and infographic software tool that empowers anyone, regardless of design experience, to create beautiful, professional data visualizations, infographics, presentations and reports in just minutes.With an intuitive drag-and-drop interface and access to a massive library of charts, maps, shapes and illustrations, Vizzlo makes it simple...
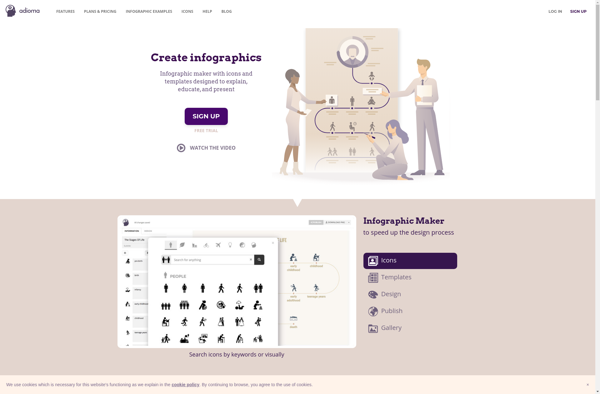
Adioma
Adioma is a cloud-based translation management system designed to help companies manage multilingual content and translation workflows. Some key features of Adioma include:Translation Memory - Stores previously translated content to promote re-use and consistency across translations.Machine Translation Integration - Integrates with machine translation engines like Google Translate for automated translations.Workflow...
