Many Eyes is a public web application by IBM for visualizing data and creating interactive visualizations. It allows users to upload datasets, create visualizations like charts, graphs, and maps, and publish them for public access.
Many Eyes: Visualize Data and Create Interactive Visualizations
A public web application by IBM for visualizing data, creating interactive visualizations, uploading datasets, and publishing them for public access.
What is Many Eyes?
Many Eyes is a public web application launched in 2007 by IBM Research for visualizing data and creating interactive visualizations. It allows users to upload datasets in various formats, create visualizations like charts, graphs, maps, networks and trees based on the data, and publish them for public viewing and analysis.
Some key features of Many Eyes include:
Intuitive drag-and-drop interface for rapidly creating visualizations from datasets
Support for variety of chart types including bar charts, line charts, scatter plots, maps, tag clouds etc
Options for customizing colors, scales, graph sizes for the visualizations
Public gallery where users can browse visualizations created by the community
Embedding and sharing options allow easy distribution of the interactive visuals
Recording of public feedback against each visualization to foster discussions
By encouraging public participation for analyzing data visually, Many Eyes aims to support data transparency and broader considerations around using data effectively for decision making by both experts and public.
Many Eyes Features
Features
Data visualization
Interactive visualizations
Public web application
Ability to upload datasets
Create charts, graphs, and maps
Publish visualizations for public access
Pricing
Free
Pros
Free to use
Collaborative platform for data analysis and visualization
Wide range of visualization types available
Ability to share and discuss visualizations with others
Cons
Limited customization options for visualizations
Requires Internet connection to access the platform
Data privacy concerns as visualizations are publicly accessible
Tableau is a leading business intelligence and data visualization platform used by organizations of all sizes to transform their data into easy-to-understand visualizations and dashboards. With Tableau, users can connect to a wide range of data sources, prepare and clean the data for analysis, and create interactive data visualizations such...
FusionCharts Suite XT is a comprehensive JavaScript charting solution that offers over 90 chart types including column, bar, pie, line, area, scatter, bubble charts and more. It also includes over 1100 maps including choropleth, markers, routes and more.Some key features of FusionCharts Suite XT:Interactive JavaScript charts, gauges and maps for...
Datamatic.io is a cloud-based no-code data pipeline platform that allows users to build data integration, transformation, and loading processes without needing to write any code. Some key features of Datamatic.io include:Graphical interface to visually design data pipelines by connecting various pre-built data source and destination connectors as well as transformation...
DIVE (Data Insight Visualization Explorer) is an open source web application developed by researchers at the MIT Media Lab. It is designed to enable interactive exploration and visualization of complex, multi-faceted datasets.Some key features of DIVE include:Intuitive drag-and-drop interface for rapidly building visualizations like maps, charts, graphs, and moreSupport for...
Piktochart is a web-based graphic design application that makes it simple for non-designers to create professional-looking visual content. Some key features of Piktochart include:Drag-and-drop interface - Easy to use even for those with no design experienceHundreds of templates - Choose from infographics, posters, presentations, social media graphics, and moreIcons, images,...
Infogr.am is a user-friendly infographic and data visualization creation software. With an easy drag-and-drop interface, it enables anyone to create sleek, interactive infographics, charts, maps and dashboards in just minutes without coding.Some key features of Infogr.am:Large library of charts and graphs (bar, pie, line, area, scatterplots etc.) to visualize dataInteractive...
Charts 4 PHP is an open-source and free PHP charting library that allows developers to create interactive charts, graphs and data visualizations using PHP. It provides an easy way to visualize data on web applications and sites built with PHP.Some key features of Charts 4 PHP:Supports various chart types including...
Marple is an open-source, Markdown-based slide deck tool for creating presentations. It provides a minimalistic editor interface to write slide content in Markdown format, which then gets rendered into an elegant slide deck for presenting.Some key features of Marple:Write slide content in easy-to-read and write Markdown format. Format headings, lists,...
Zoho Analytics is a powerful yet user-friendly business intelligence and data analytics platform used by organizations of all sizes. It allows you to connect data from multiple sources including databases, cloud apps, and files, enabling a unified view of business data.With an intuitive drag-and-drop interface, Zoho Analytics makes it easy...
Birst is a cloud-native business intelligence and analytics platform used by enterprises to unify, understand, and act on data. Key capabilities and benefits include:Cloud data warehousing to bring together data from multiple sources for analysisInteractive dashboards and visualizations to spot trends and insightsSelf-service analytics empowering users across the organization to...
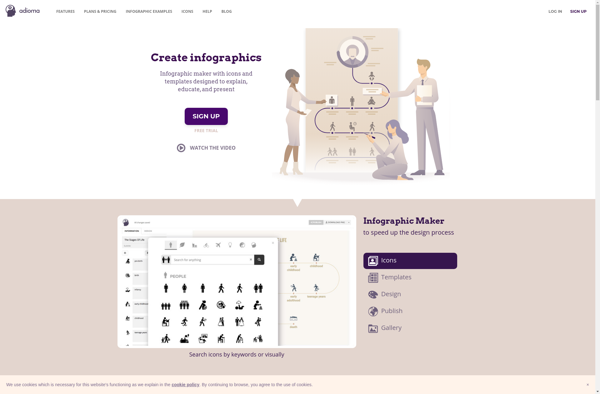
Adioma is a cloud-based translation management system designed to help companies manage multilingual content and translation workflows. Some key features of Adioma include:Translation Memory - Stores previously translated content to promote re-use and consistency across translations.Machine Translation Integration - Integrates with machine translation engines like Google Translate for automated translations.Workflow...