Birst
Birst is a cloud-based business intelligence and analytics platform that helps organizations visualize and analyze data to gain insights. It offers data warehousing, reporting, and dashboards.

Birst: Cloud-Based Business Intelligence
A cloud-based analytics platform for data visualization, analysis, and insight-driven decision making.
What is Birst?
Birst is a cloud-native business intelligence and analytics platform used by enterprises to unify, understand, and act on data. Key capabilities and benefits include:
- Cloud data warehousing to bring together data from multiple sources for analysis
- Interactive dashboards and visualizations to spot trends and insights
- Self-service analytics empowering users across the organization to explore data
- Embedded BI allowing analytics to be included in other applications
- AI assistance and automation in the analytics workflow
- Agile development principles enabling rapid iterations and feature releases
- Available on both public or private cloud infrastructure for flexibility
- Integrates with popular data sources and BI tools
- Flexible subscription pricing suitable for a range of customer needs
Birst positions itself as smarter, faster, and more user-friendly than traditional on-premises BI platforms. It aims to enable a data-driven culture and make analytics accessible to more business users through its automation and AI-assisted tools.
Birst Features
Features
- Cloud-based BI and analytics platform
- Data warehousing and ETL
- Ad-hoc reporting and dashboards
- Data visualization and discovery
- Predictive analytics and machine learning
- Pre-built connectors and templates
- Mobile BI apps
- Embedded BI capabilities
- Collaboration tools
Pricing
- Subscription-Based
Pros
Intuitive drag-and-drop interface
Quick deployment with pre-built templates
Scalable cloud infrastructure
Real-time data analytics
Embedded BI simplifies distribution
Broad range of data connectivity
Strong visualization and dashboarding
Collaborative analytics
Cons
Can be expensive for smaller businesses
Limited customization of some features
Less flexibility than open-source BI
Requires training for full utilization
Not ideal for complex data modeling
Official Links
Reviews & Ratings
Login to ReviewThe Best Birst Alternatives
View all Birst alternatives with detailed comparison →
Top Business & Commerce and Business Intelligence and other similar apps like Birst
Here are some alternatives to Birst:
Suggest an alternative ❐Microsoft Power BI
Microsoft Power BI is a powerful business analytics service developed by Microsoft. It empowers users to transform raw data into meaningful insights, create interactive reports and dashboards, and share data-driven stories within an organization. Power BI is designed to help businesses and individuals make informed decisions based on a comprehensive...

Tableau
Tableau is a leading business intelligence and data visualization platform used by organizations of all sizes to transform their data into easy-to-understand visualizations and dashboards. With Tableau, users can connect to a wide range of data sources, prepare and clean the data for analysis, and create interactive data visualizations such...

QlikView
QlikView is a business intelligence and data visualization platform used to create interactive dashboards and analytics applications. It was first released in 1993 by the Swedish company Qlik. Key features of QlikView include:Associative data modeling and in-memory analytics engine - Allows fast analysis of large, disparate datasets without predefined schema...

Google Charts
Google Charts is a robust and flexible JavaScript charting and data visualization library provided for free by Google. It offers developers a highly customizable way to create interactive charts, graphs, and data tables that seamlessly integrate into web pages and applications.With Google Charts, you can visualize complex data sets and...

Pentaho
Pentaho is a comprehensive open source business intelligence (BI) suite that provides a range of data integration, analytics, visualization, reporting, data mining, and workflow capabilities. It is designed to help businesses consolidate data from disparate sources for unified analytics and reporting.Some of the key capabilities and components of Pentaho include:Data...

Plotly
Plotly is an open-source graphing library that allows users to create interactive, publication-quality graphs, charts, and dashboards. It supports Python, R, JavaScript, and Excel as programming languages. Some key features of Plotly include:Interactive visualization - Plotly charts are interactive with features like hover text, zooming, panning, selectable legends, and editable...

D3.js
D3.js, or D3, is an open-source JavaScript library used for visualizing data with web standards. D3 stands for Data-Driven Documents. It allows developers to bind arbitrary data to the Document Object Model (DOM) and then apply data-driven transformations to the document. This allows web developers to create dynamic, interactive data...

Many Eyes
Many Eyes is a public web application launched in 2007 by IBM Research for visualizing data and creating interactive visualizations. It allows users to upload datasets in various formats, create visualizations like charts, graphs, maps, networks and trees based on the data, and publish them for public viewing and analysis.Some...
Tableau Prep
Tableau Prep is a self-service data preparation application designed to empower users to quickly and easily combine, shape, and clean their data to speed up analytics. Key features include:Intuitive visual interface - Tableau Prep allows users to eliminate complex coding and scripting to prepare data through visual steps and drag-and-drop...
Jedox
Jedox is a comprehensive business intelligence and corporate performance management platform designed for mid-size to large enterprises. It provides a wide range of capabilities including:Multi-dimensional online analytical processing (OLAP) for complex data analysis and modelingPlanning, budgeting, and forecasting features for financial planning and simulationCustomizable dashboards and self-service reporting for business...
Dotnet Report Builder
dotnet Report Builder is an open-source reporting tool designed specifically for .NET applications. It allows .NET developers to create rich, customizable reports for both web and desktop applications with minimal coding.Some key features of dotnet Report Builder include:Supports connecting to various data sources like SQL Server, Oracle, MongoDB, REST APIs,...
EZlytix
EZlytix is a business intelligence and data analytics software designed to help companies make data-driven decisions. It allows users to connect to various data sources, prepare and cleanse data, and create interactive dashboards and reports to gain insights.Some key features of EZlytix include:Intuitive drag-and-drop interface to build workflows, dashboards and...
Keeeb
Keeeb is an open-source, keyboard-focused note taking and productivity app for Windows, Mac and Linux operating systems. It is designed specifically for power users who prefer to use keyboard shortcuts over reaching for the mouse.Some of the key features of Keeeb include:Quick note taking - easily capture thoughts, notes, web...

Marple
Marple is an open-source, Markdown-based slide deck tool for creating presentations. It provides a minimalistic editor interface to write slide content in Markdown format, which then gets rendered into an elegant slide deck for presenting.Some key features of Marple:Write slide content in easy-to-read and write Markdown format. Format headings, lists,...

RAWGraphs
RAWGraphs is a free, open-source web tool created for anyone to easily visualize and share data using the most common graphical formats. The simple drag and drop interface makes it easy for non-experts to quickly generate a wide variety of charts and diagrams that can be exported and shared as...

WhereScape Data Vault Express
WhereScape Data Vault Express is a lightweight data warehouse automation solution built specifically for data vault modeling. It helps organizations accelerate analytics projects by automating the time-consuming tasks associated with data warehousing.With an easy-to-use graphical interface, WhereScape Data Vault Express allows users to design data vault schema models simply by...

Prognoz
Prognoz is a comprehensive business forecasting and predictive analytics platform designed to help organizations improve forecast accuracy and operational efficiency. It leverages sophisticated artificial intelligence algorithms, time series analysis, simulation modeling, and machine learning techniques to uncover patterns in historical data and generate accurate demand forecasts.Key features of Prognoz include:Intuitive...
Mantle Enterprise Analytics
Mantle Enterprise Analytics is a robust business intelligence and analytics solution catered towards large enterprises. It provides a wide range of capabilities to collect, store, process, analyze, and visualize data across the organization.Key features include:Interactive dashboards and reports for data visualizationPredictive modeling, forecasting, and machine learning algorithmsConnectors to extract data...
Keboola Connection
Keboola Connection is a cloud-based data integration and transformation platform designed to help businesses efficiently manage their data pipelines and gain actionable insights. Some key features of Keboola Connection include:Drag-and-drop interface to visually build data workflows and ETL processes without codingPre-built connectors to easily integrate data from various sources like...
Jolicharts
Jolicharts is a feature-rich JavaScript charting library that allows you to easily add interactive charts and graphs to web applications and dashboards. With Jolicharts, you can create over 30 types of charts including line charts, bar charts, pie charts, scatter plots, stacked bar charts and more.Some key features of Jolicharts...
KPI watchdog
KPI Watchdog is a robust business intelligence and data analytics platform designed to help companies track, analyze, and visualize key performance indicators (KPIs) in real-time. It provides powerful, customizable dashboards and reporting tools to monitor essential metrics across all departments and roles.With KPI Watchdog, businesses can connect data from multiple...
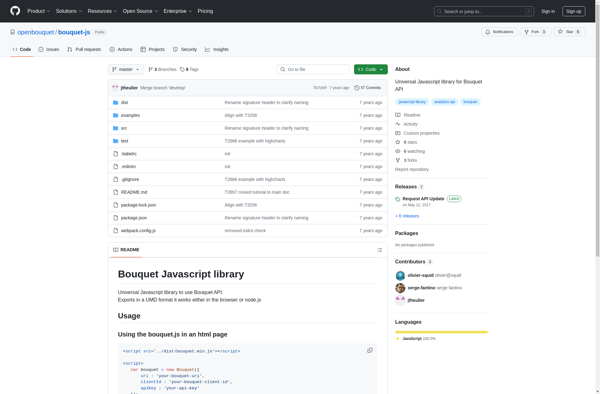
Bouquet
Bouquet is an open-source and free office suite that provides alternatives to Microsoft Office apps like Word, Excel, and PowerPoint. It includes a word processor, spreadsheet program, and presentation software that allows users to create, edit, and share documents, spreadsheets, and slide decks.The word processor, Bouquet Words, provides similar functionality...
DataPad
DataPad is a user-friendly data analysis and visualization software designed for researchers of all levels. With its intuitive drag-and-drop interface, DataPad allows users to easily import, clean, analyze and visualize complex datasets without coding.Key features include:Import data from CSV, Excel, databases and other sourcesInteractive drag-and-drop workflow to clean, analyze and...
DrillDb
DrillDb is an open-source distributed SQL query engine for big data. It was originally developed by MapR and is now managed by the Apache Software Foundation. DrillDb allows users to analyze a variety of NoSQL databases and file systems without requiring them to structure the data upfront.Some key features and...

Pyramid Analytics
Pyramid Analytics is an advanced business intelligence and analytics platform designed to empower organizations to make faster, more informed decisions. It combines governed self-service analytics capabilities with artificial intelligence-powered features to enable employees to easily access, explore, and act on governed data.Key capabilities of Pyramid Analytics include:Unified governed self-service analytics...