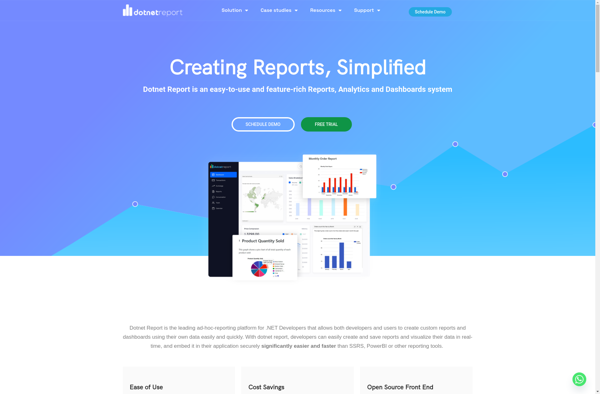
dotnet Report Builder is an open-source reporting tool for .NET applications. It allows developers to easily create rich, customizable reports for web and desktop applications. The tool supports various data sources and output formats.
dotnet Report Builder: Open-Source Reporting Tool for .NET Applications
dotnet Report Builder is an open-source reporting tool for .NET applications. It allows developers to easily create rich, customizable reports for web and desktop applications. The tool supports various data sources and output formats.
What is Dotnet Report Builder?
dotnet Report Builder is an open-source reporting tool designed specifically for .NET applications. It allows .NET developers to create rich, customizable reports for both web and desktop applications with minimal coding.
Some key features of dotnet Report Builder include:
Supports connecting to various data sources like SQL Server, Oracle, MongoDB, REST APIs, and more
Allows developers to build reports visually with an intuitive drag-and-drop interface
Includes various pre-defined report templates and layouts to speed up development
Supports exporting reports to multiple formats like PDF, Excel, Word, HTML, CSV, JSON, and XML
Easy to integrate reporting capabilities into existing .NET apps with the included .NET library
Completely open-source and customizable unlike many commercial reporting tools
Has extensive documentation and samples to help .NET devs get started quickly
With its focus on .NET ecosystem and developers, rich feature set, and open-source nature, dotnet Report Builder aims to be the best-in-class reporting solution for .NET applications.
Dotnet Report Builder Features
Features
Drag-and-drop report designer
Supports various data sources like SQL Server, Oracle, OData, Object, XML
Export reports to PDF, Excel, Word, HTML, CSV and Image formats
Rich visualization options including charts, maps, sparklines etc
Parameters, drill-down reports and sub-reports support
Tableau is a leading business intelligence and data visualization platform used by organizations of all sizes to transform their data into easy-to-understand visualizations and dashboards. With Tableau, users can connect to a wide range of data sources, prepare and clean the data for analysis, and create interactive data visualizations such...
QlikView is a business intelligence and data visualization platform used to create interactive dashboards and analytics applications. It was first released in 1993 by the Swedish company Qlik. Key features of QlikView include:Associative data modeling and in-memory analytics engine - Allows fast analysis of large, disparate datasets without predefined schema...
Sisense is a business intelligence and data analytics software platform designed to help non-technical users prepare, analyze and visualize complex data. Some key features of Sisense include:Intuitive drag-and-drop interface for building interactive dashboards and visualizations like charts, graphs and pivot tables without coding.Ability to connect to wide variety of data...
QueryTree is a visual SQL analytics software designed to make query building fast and easy for any skill level. It features an intuitive drag-and-drop interface that allows users to construct complex SQL queries visually without typing code.Some key features of QueryTree include:Visual query builder with drag-and-drop fields and quick type...
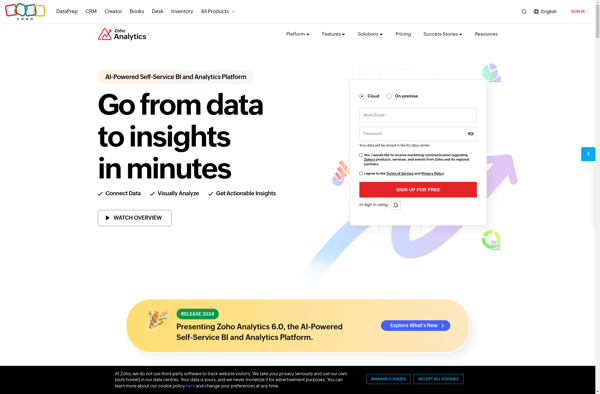
Zoho Analytics is a powerful yet user-friendly business intelligence and data analytics platform used by organizations of all sizes. It allows you to connect data from multiple sources including databases, cloud apps, and files, enabling a unified view of business data.With an intuitive drag-and-drop interface, Zoho Analytics makes it easy...
Parrily is a cloud-based project management and team collaboration software designed specifically for agile development teams. It provides a variety of features to help manage projects, track progress, and facilitate teamwork:- Kanban boards - Visualize tasks and user stories on digital kanban boards. Move items through defined workflows to track...
KiniMetrix is a cloud-based software platform designed for healthcare providers to help them better manage their practices, engage with patients, gain population health insights, and handle administrative tasks. It combines features typically found in separate electronic health record (EHR), practice management, patient portal and business intelligence solutions into one unified...
Birst is a cloud-native business intelligence and analytics platform used by enterprises to unify, understand, and act on data. Key capabilities and benefits include:Cloud data warehousing to bring together data from multiple sources for analysisInteractive dashboards and visualizations to spot trends and insightsSelf-service analytics empowering users across the organization to...
YellowFin is an open-source autoML library for Python that automates the tuning of hyperparameters and model architecture search to help users achieve high accuracy with machine learning models. Developed by researchers at MIT, IIT, and Adobe Research, YellowFin aims to make state-of-the-art machine learning techniques accessible to non-experts.Some key capabilities...
JReport is a business intelligence and reporting tool used to create interactive reports and dashboards from multiple data sources. It has an easy-to-use drag-and-drop interface that allows non-technical users to quickly build reports and visualize data without coding.Some key features of JReport include:Connecting to various databases, cloud apps, big data...