Parrily icon

Parrily

Parrily is a project management and collaboration software designed for agile teams. It includes features like kanban boards, roadmaps, tasks and subtasks, time tracking, reports, team communication and document sharing.

What is Parrily?

Parrily is a cloud-based project management and team collaboration software designed specifically for agile development teams. It provides a variety of features to help manage projects, track progress, and facilitate teamwork:

- Kanban boards - Visualize tasks and user stories on digital kanban boards. Move items through defined workflows to track progress from idea to launch.

- Backlogs and roadmaps - Prioritize features and plan releases using backlogs. Map out long-term plans on shareable, visual roadmaps.

- Tasks and subtasks - Break down projects into manageable tasks and subtasks. Assign them to team members and track progress.

- Time tracking - Use timers to record time spent on tasks and generate reports to understand where efforts are focused.

- Teams and permissions - Create unlimited teams and control access through customizable permission levels for owners, admins, members etc.

- Activity streams and notifications - Stay up-to-date with real-time activity feeds and @mentions in comments.

- Reports and dashboards - Gain key insights using the built-in reporting functionality. Monitor team productivity and status.

- Integrations - Connect the tools your team already uses like GitHub, Dropbox, Google Drive etc.

- Mobile apps - Access Parrily on-the-go via iOS and Android apps to manage projects and collaborate with your team from anywhere.

The Best Parrily Alternatives

Top Apps like Parrily

Microsoft Power BI, Tableau, JasperReports, SQL Server Reporting Services, Talend, Looker Studio, QlikView, Pentaho, Sisense, Amazon QuickSight, dotnet Report Builder, ReportServer are some alternatives to Parrily.

Microsoft Power BI

Microsoft Power BI is a powerful business analytics service developed by Microsoft. It empowers users to transform raw data into meaningful insights, create interactive reports and dashboards, and share data-driven stories within an organization. Power BI is designed to help businesses and individuals make informed decisions based on a comprehensive...

Tableau

Tableau is a leading business intelligence and data visualization platform used by organizations of all sizes to transform their data into easy-to-understand visualizations and dashboards. With Tableau, users can connect to a wide range of data sources, prepare and clean the data for analysis, and create interactive data visualizations such...

JasperReports

JasperReports is an open source Java reporting library that can generate various types of reports from different data sources. It is very flexible and offers many features:Supports connecting to various data sources like SQL databases, NoSQL databases, XML, JSON, CSV files, etc.Can generate reports in multiple formats including...

SQL Server Reporting Services

SQL Server Reporting Services (SSRS) is a comprehensive enterprise reporting platform from Microsoft that allows users to create and deliver interactive, mobile-ready reports across the organization. SSRS can connect to almost any data source to build rich, interactive reports with charts, maps, sparklines and more.Key features and capabilities of...

Talend

Talend is an open source data integration and management platform designed to help organizations effectively collect, transform, cleanse and share data across systems and teams. Some key capabilities and benefits of Talend include:Graphical drag-and-drop interface to build data integration jobs and workflows without codingOver 900 pre-built data connectors to leading...

Looker Studio

Looker Studio is a business intelligence and analytics platform designed to help companies analyze data and gain valuable insights. It provides an intuitive, web-based interface that enables users without technical skills to explore, visualize and share data easily.Some key capabilities and benefits of Looker Studio include:Interactive dashboards -...

QlikView

QlikView is a business intelligence and data visualization platform used to create interactive dashboards and analytics applications. It was first released in 1993 by the Swedish company Qlik. Key features of QlikView include:Associative data modeling and in-memory analytics engine - Allows fast analysis of large, disparate datasets without predefined schema...

Pentaho

Pentaho is a comprehensive open source business intelligence (BI) suite that provides a range of data integration, analytics, visualization, reporting, data mining, and workflow capabilities. It is designed to help businesses consolidate data from disparate sources for unified analytics and reporting.Some of the key capabilities and components of Pentaho...

Sisense

Sisense is a business intelligence and data analytics software platform designed to help non-technical users prepare, analyze and visualize complex data. Some key features of Sisense include:Intuitive drag-and-drop interface for building interactive dashboards and visualizations like charts, graphs and pivot tables without coding.Ability to connect to wide variety...

Amazon QuickSight

Amazon QuickSight is a fast, cloud-powered business intelligence service that makes it easy to build visualizations, perform ad-hoc analysis, and quickly get business insights from your data. Some key features include:Intuitive visual interface that makes it easy to visualize and explore dataBroad data connectivity to connect to data sources...

Dotnet Report Builder

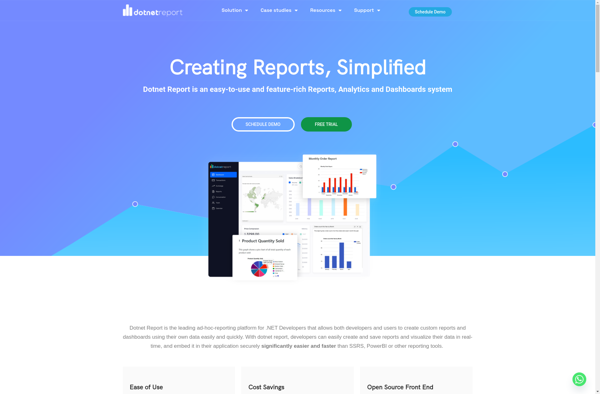
dotnet Report Builder is an open-source reporting tool designed specifically for .NET applications. It allows .NET developers to create rich, customizable reports for both web and desktop applications with minimal coding.Some key features of dotnet Report Builder include:Supports connecting to various data sources like SQL Server, Oracle, MongoDB...

ReportServer

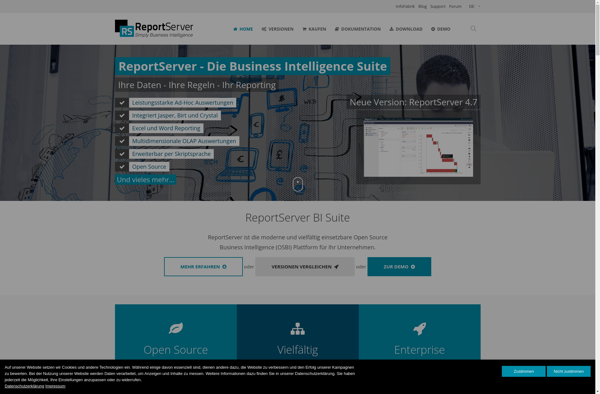
ReportServer is an open source business intelligence and reporting platform used to create and distribute interactive reports and dashboards. It supports connecting to various relational and NoSQL databases, flat files, REST APIs, and other data sources to build reports.Some key capabilities and benefits of ReportServer include:Ad-hoc reporting for...