Looker Studio is a business intelligence and data analytics platform that enables users to explore, visualize and share data through an intuitive web interface. It features drag-and-drop tools to build dashboards, reports and data applications quickly without coding.
Explore, visualize and share data through an intuitive web interface, build dashboards, reports and data applications with drag-and-drop tools without coding
What is Looker Studio?
Looker Studio is a business intelligence and analytics platform designed to help companies analyze data and gain valuable insights. It provides an intuitive, web-based interface that enables users without technical skills to explore, visualize and share data easily.
Some key capabilities and benefits of Looker Studio include:
Interactive dashboards - Users can create rich, customizable dashboards with advanced filters, drilldowns and visualization options like charts, maps and pivot tables.
Ad hoc analysis - It allows business users to ask questions of their data spontaneously without relying on technical resources.
Data modeling - The platform understands complex data structures and relationships between tables for accurate analysis.
Visual data exploration - Drag-and-drop tools make it simple to visualize current data without any coding.
Shared reporting environment - Dashboards, reports and scheduled looks created can be organized, annotated and shared across the organization.
Embedded analytics - Insights can be embedded into internal web portals, apps and systems to reach relevant teams.
Flexible deployment options - Looker can be deployed on cloud, on premises or in hybrid mode to suit security and scalability needs.
With an intuitive interface optimized for business users, Looker Studio aims to empower companies to explore all of their data, unearth valuable insights and make smarter data-driven decisions.
Looker Studio Features
Features
Drag-and-drop interface to build dashboards, reports and apps
Metabase is an open source business intelligence platform and analytics tool. It allows anyone on a team to ask questions about their data, explore it, and share insights with others through easy-to-create dashboards, charts, and visualizations. Metabase provides an intuitive frontend interface so users can get answers and discover trends...
Google Fusion Tables is a cloud-based service designed for working with structured data. It allows users to upload, host, manage, share, visualize and collaborate on tabular datasets. Some of the key features of Google Fusion Tables include:Data importing from various formats like CSV, KML, spreadsheetsData exporting to formats like CSV...
Snapboard is an online visual collaboration software used by teams for brainstorming, organizing workflows, managing projects, and more. It provides an infinite virtual whiteboard where users can add sticky notes, images, freehand drawings, and diagrams to capture ideas and map out plans.Key features of Snapboard include:Infinite canvas for adding unlimited...
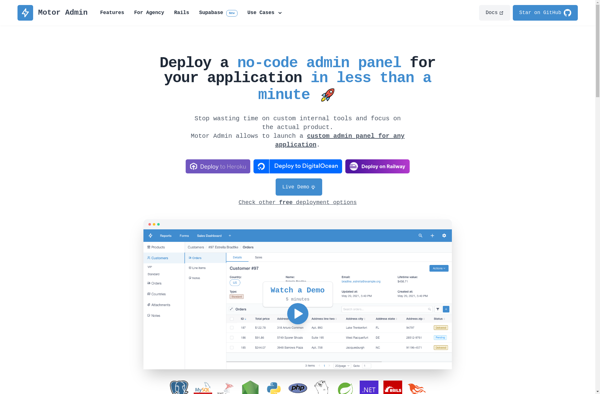
Motor Admin is an end-to-end dealership management software designed specifically for automobile dealerships. It provides a centralized platform to manage key aspects of running a dealership including:Inventory Management - Track all vehicles from acquisition to sale, including accounting, reconditioning and promotions. Manage inventory across multiple locations.Customer Relationship Management - Store...
Redash is an open-source business intelligence and data visualization web application. It allows users to connect to multiple data sources including SQL databases, query and visualize the data, and create interactive dashboards to share insights.Some key features of Redash:Connect to data sources like PostgreSQL, MySQL, SQL Server, Redshift, BigQuery and...
Meltano is an open source data integration and ELT (extract, load, transform) platform aimed at helping data engineers and analysts more easily move, transform, and load data from various sources into data warehouses or visualization platforms. Features include:Visual interface for building data pipelines by connecting data sources, adding transformations, scheduling...
Sisense is a business intelligence and data analytics software platform designed to help non-technical users prepare, analyze and visualize complex data. Some key features of Sisense include:Intuitive drag-and-drop interface for building interactive dashboards and visualizations like charts, graphs and pivot tables without coding.Ability to connect to wide variety of data...
Chartio is a cloud-based business intelligence and data visualization platform designed to help companies analyze data and share actionable insights. It allows users to connect a variety of data sources including databases, cloud apps, and spreadsheets, and build interactive dashboards and charts.Key features of Chartio include:Intuitive drag and drop interface...
AnswerMiner is an artificial intelligence-powered software that helps companies improve their customer support operations and experiences. It analyzes large volumes of customer service conversation data, including emails, chat transcripts, and call center notes, to provide actionable insights.The key features and benefits of AnswerMiner include:Understanding Frequent Customer Questions and Pain Points:...
LightCat is an emerging open-source password manager that allows users to securely store website logins, credit card numbers, identities, and other sensitive information behind one master password. It utilizes strong AES-256 bit encryption to protect user data and ensures information is accessible only to the owner.Some key features of LightCat...
Parquet Data Viewer is an open-source, cross-platform application for visually analyzing and exploring Parquet data files. Developed by Atlan, it provides an intuitive graphical interface to examine the contents of Parquet files without needing to write code.With Parquet Data Viewer, you can quickly:See the data types, compression types, row group...
Amazon QuickSight is a fast, cloud-powered business intelligence service that makes it easy to build visualizations, perform ad-hoc analysis, and quickly get business insights from your data. Some key features include:Intuitive visual interface that makes it easy to visualize and explore dataBroad data connectivity to connect to data sources like...
Advanced ETL Processor Enterprise is a robust and scalable extract, transform, and load (ETL) solution designed for enterprise use. It provides a wide range of connectivity to different data sources and destinations, along with powerful data transformation capabilities.Key features include:Graphical workflow designer to visually map out ETL processesOver 200 pre-built...
DashThis is a user-friendly project management and task tracking application designed for small teams and businesses. It provides an intuitive interface to plan projects, create tasks, set due dates, assign work to team members, track progress, and collaborate with others.Some key features of DashThis include:Flexible project views - See all...
ChartExpo is a versatile business intelligence and data visualization software designed to help companies visualize and analyze data through interactive dashboards. It allows users to connect to various data sources including SQL databases, cloud apps, Excel files, etc. and pull data into the software.Some key features of ChartExpo include:Drag-and-drop interface...
Datapine is an easy-to-use business analytics and dashboard software designed to help businesses visualize, analyze and gain insights from their data. It provides powerful tools to access, clean, unify and model data from multiple sources, including SQL and NoSQL databases, cloud apps, spreadsheets, CSV files and more.Key features of Datapine...
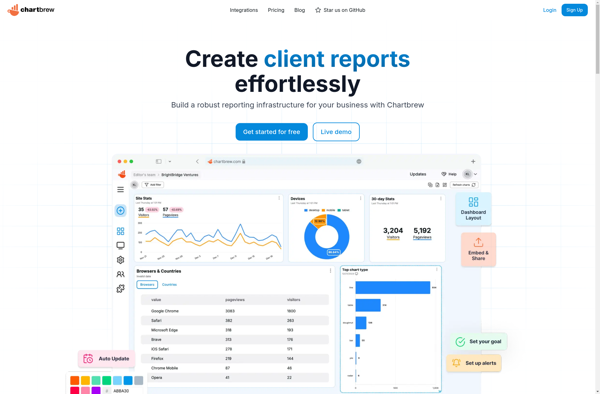
Chartbrew is an open-source business intelligence and data visualization platform used to analyze data and create interactive charts, graphs, and dashboards. It has an easy-to-use drag and drop interface that allows users to connect to SQL, NoSQL, CSV data sources, and SaaS applications to visualize data and find insights.Some key...
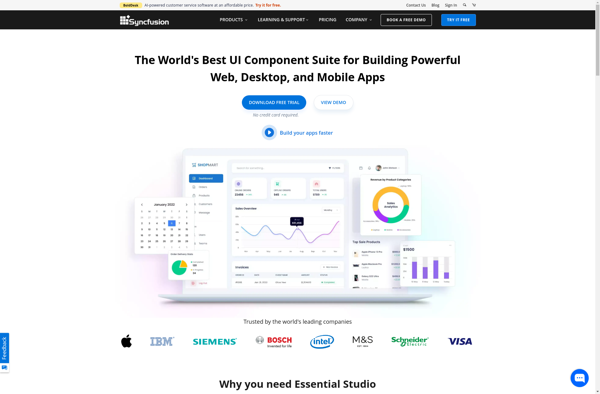
The Syncfusion Dashboard Platform is a comprehensive business intelligence and analytics solution designed specifically for data visualization and dashboard creation. It allows you to connect to almost any data source, including SQL databases, Excel files, REST APIs, and more, and transform that data into stunning, interactive dashboards.With an intuitive drag-and-drop...
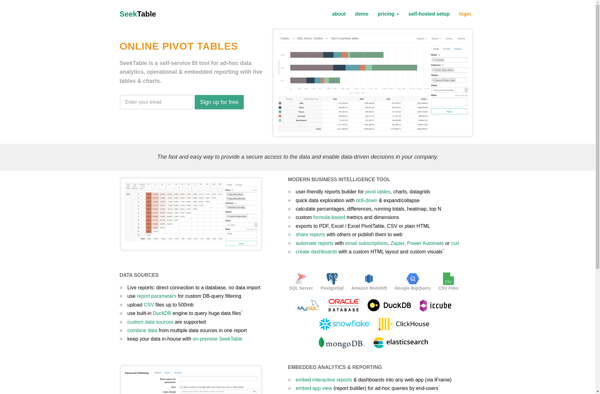
SeekTable is a browser extension and web app that helps you navigate websites more efficiently. It works by outlining tables, charts, and graphs on web pages so you can easily scan, search, and summarize data.Once installed, SeekTable will detect tables, charts, and graphs on a web page and draw red...
JetPack Data is a comprehensive data management and analytics platform designed to help companies make better use of their data. It provides a suite of tools to ingest, store, analyze, and visualize data from a variety of sources.Key features of JetPack Data include:Flexible data ingestion from databases, cloud apps, files,...
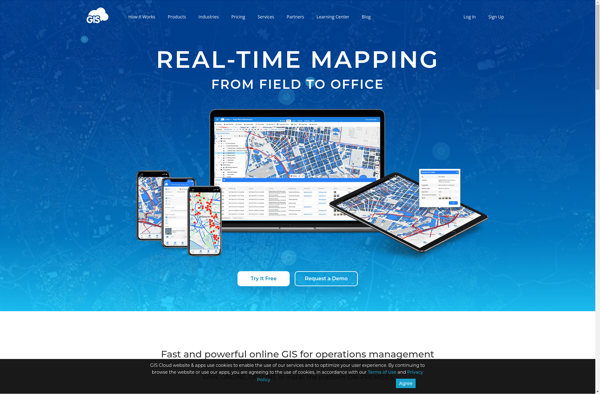
GIS Cloud is a feature-rich, cloud-based geographic information system (GIS) software designed for organizations of all sizes. It enables users to easily create, edit, analyze, and publish geospatial data through an intuitive web interface and mobile apps.Key capabilities and benefits of GIS Cloud include:Interactive web map building with access to...
Cirkulate is an open-source, self-hosted alternative to Google Analytics that allows web developers and site owners to track traffic and analyze usage statistics without compromising visitor privacy. Some key features of Cirkulate include:Lightweight and easy to install. Cirkulate uses a SQLite database and PHP scripts, making it simple to set...
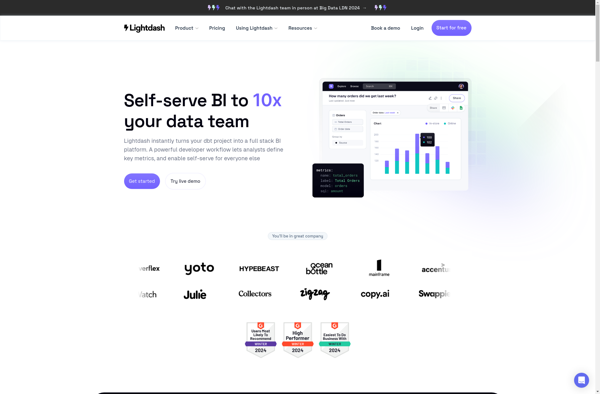
Lightdash is an open-source business intelligence and analytics platform for building interactive dashboards and reports. It allows you to visualize and explore your data to uncover insights and make better decisions.Some key features and capabilities of Lightdash include:Connect to a wide range of data sources like MySQL, PostgreSQL, BigQuery, and...
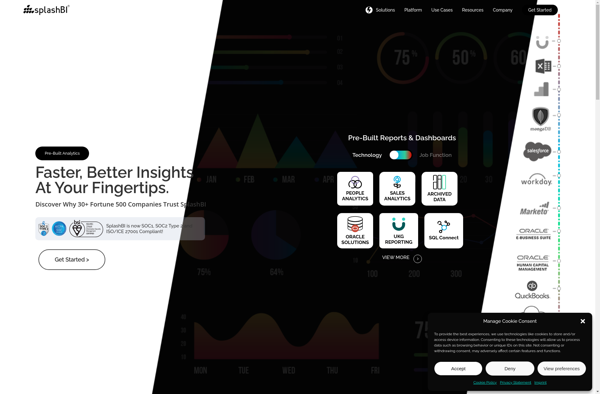
SplashBI is a cloud-based business intelligence and data visualization platform designed for small and medium businesses. Some key features of SplashBI include:Intuitive drag-and-drop interface for building interactive dashboards, charts, tables and reportsLibrary of customizable widgets and visualizations including bar, line and pie chartsAutomated report scheduling and distributionReal-time data connectivity to...
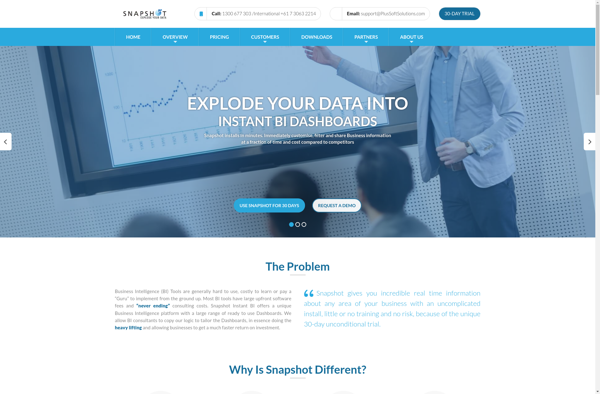
Snapshot BI is a business intelligence and analytics software designed specifically for small and medium-sized businesses. It provides an easy-to-use platform for companies to visualize, analyze, and gain actionable insights from their business data.Key features of Snapshot BI include:Interactive dashboards and reports - Create customized dashboards with drag-and-drop widgets to...
Parrily is a cloud-based project management and team collaboration software designed specifically for agile development teams. It provides a variety of features to help manage projects, track progress, and facilitate teamwork:- Kanban boards - Visualize tasks and user stories on digital kanban boards. Move items through defined workflows to track...
KiniMetrix is a cloud-based software platform designed for healthcare providers to help them better manage their practices, engage with patients, gain population health insights, and handle administrative tasks. It combines features typically found in separate electronic health record (EHR), practice management, patient portal and business intelligence solutions into one unified...
Bime is a flexible business intelligence and analytics platform suitable for modern data teams. It provides an easy way to connect to various data sources like databases, cloud apps, and business software to build interactive dashboards, reports, and analytics.Some key capabilities and benefits of Bime include:Intuitive drag-and-drop interface to visualize...
Revere is a powerful software platform that enables companies to easily create sophisticated conversational experiences like chatbots and digital assistants. Its drag-and-drop, no-code tools allow anyone, even without technical expertise, to visually assemble conversation flows, inserting logic, variables, integrations with other systems and more to automate interactions.Revere also provides low-code...
bipp Analytics is a business intelligence and data visualization software that empowers users to connect their data, analyze it visually, and extract meaningful insights. Some key features of bipp Analytics include:Data Connectors - Connect your data from databases, cloud apps, Excel, etc. with pre-built connectors.Interactive Dashboards - Build visually appealing,...