Google Fusion Tables is a cloud-based service for data management and integration. It allows users to upload, host, manage, share, visualize, and collaborate on tabular datasets. Key features include data importing, exporting, filtering, sorting, aggregation, and joining.
Google Fusion Tables: Cloud-based Data Management and Integration
Google Fusion Tables is a cloud-based service for data management and integration. It allows users to upload, host, manage, share, visualize, and collaborate on tabular datasets. Key features include data importing, exporting, filtering, sorting, aggregation, and joining.
What is Google Fusion Tables?
Google Fusion Tables is a cloud-based service designed for working with structured data. It allows users to upload, host, manage, share, visualize and collaborate on tabular datasets. Some of the key features of Google Fusion Tables include:
Data importing from various formats like CSV, KML, spreadsheets
Data exporting to formats like CSV for further analysis
Filtering, sorting, aggregation and joining of datasets
Visualization through charts, graphs, maps and network graphs
Collaboration by sharing datasets privately or publicly
Integration with other Google services like Google Drive, Maps and Sites
It provides a simple but powerful web interface and API to handle large datasets without the need to setup any servers or infrastructure. Popular use cases include data warehousing, geospatial analysis, network analysis and sharing data online. The service is available freely to consumers with certain usage limits and also as a paid version - Fusion Tables Advanced for additional capability.
Google Fusion Tables Features
Features
Upload, host and manage tabular datasets
Visualize and explore data through charts, maps, timelines
Share and collaborate on datasets
Import/export data from various formats (CSV, KML, Spreadsheets)
Join tables and filter/sort data
Geocode addresses and locations
Develop web apps and sites with Fusion Tables API
Pricing
Free
Discontinued
Pros
Free to use
Integrates well with other Google services
Scales to large datasets
Simple and intuitive UI
Real-time collaboration features
Variety of visualization options
Cons
Limited to 100MB per table (paid plans allow more)
Microsoft Power BI is a powerful business analytics service developed by Microsoft. It empowers users to transform raw data into meaningful insights, create interactive reports and dashboards, and share data-driven stories within an organization. Power BI is designed to help businesses and individuals make informed decisions based on a comprehensive...
Tableau is a leading business intelligence and data visualization platform used by organizations of all sizes to transform their data into easy-to-understand visualizations and dashboards. With Tableau, users can connect to a wide range of data sources, prepare and clean the data for analysis, and create interactive data visualizations such...
Looker Studio is a business intelligence and analytics platform designed to help companies analyze data and gain valuable insights. It provides an intuitive, web-based interface that enables users without technical skills to explore, visualize and share data easily.Some key capabilities and benefits of Looker Studio include:Interactive dashboards - Users can...
Pentaho is a comprehensive open source business intelligence (BI) suite that provides a range of data integration, analytics, visualization, reporting, data mining, and workflow capabilities. It is designed to help businesses consolidate data from disparate sources for unified analytics and reporting.Some of the key capabilities and components of Pentaho include:Data...
Redash is an open-source business intelligence and data visualization web application. It allows users to connect to multiple data sources including SQL databases, query and visualize the data, and create interactive dashboards to share insights.Some key features of Redash:Connect to data sources like PostgreSQL, MySQL, SQL Server, Redshift, BigQuery and...
Sisense is a business intelligence and data analytics software platform designed to help non-technical users prepare, analyze and visualize complex data. Some key features of Sisense include:Intuitive drag-and-drop interface for building interactive dashboards and visualizations like charts, graphs and pivot tables without coding.Ability to connect to wide variety of data...
Amazon QuickSight is a fast, cloud-powered business intelligence service that makes it easy to build visualizations, perform ad-hoc analysis, and quickly get business insights from your data. Some key features include:Intuitive visual interface that makes it easy to visualize and explore dataBroad data connectivity to connect to data sources like...
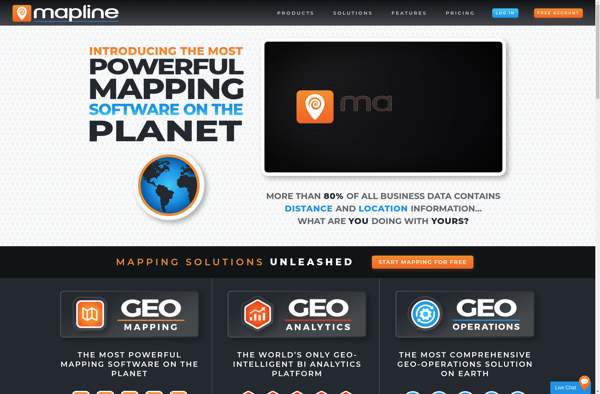
Mapline is an open-source, self-hosted web application that allows users to create custom maps for free. It is an alternative to proprietary services like Google My Maps.Some key features of Mapline include:Ability to add markers, lines, shapes, and text notes to your mapsSupport for multiple layers on a single mapOptions...
Datapine is an easy-to-use business analytics and dashboard software designed to help businesses visualize, analyze and gain insights from their data. It provides powerful tools to access, clean, unify and model data from multiple sources, including SQL and NoSQL databases, cloud apps, spreadsheets, CSV files and more.Key features of Datapine...
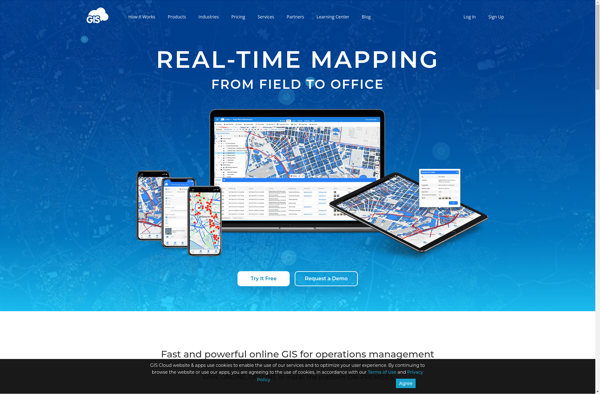
GIS Cloud is a feature-rich, cloud-based geographic information system (GIS) software designed for organizations of all sizes. It enables users to easily create, edit, analyze, and publish geospatial data through an intuitive web interface and mobile apps.Key capabilities and benefits of GIS Cloud include:Interactive web map building with access to...
Datacopia is an open-source data workflow and pipeline tool designed for integrating, moving, and transforming data across databases, data warehouses, lakes, and other systems. It provides an easy to use visual interface to build and manage complex data pipelines without coding.Key features of Datacopia include:Visual data pipeline designer to model...