Datapine is an easy-to-use business analytics and dashboard software that allows businesses to visualize and analyze data to gain insights and make better decisions. It helps connect data sources, create interactive dashboards, charts and maps, and collaborate across teams.
Easy-to-use business analytics and dashboard software to visualize and analyze data, connect data sources, and collaborate across teams.
What is Datapine?
Datapine is an easy-to-use business analytics and dashboard software designed to help businesses visualize, analyze and gain insights from their data. It provides powerful tools to access, clean, unify and model data from multiple sources, including SQL and NoSQL databases, cloud apps, spreadsheets, CSV files and more.
Key features of Datapine include:
Drag-and-drop dashboard designer to easily create custom dashboards with KPIs, charts, tables, gauges, maps and other widgets.
Data connectors for 300+ data sources. It helps integrate data from cloud and on-prem apps, databases, files, APIs, etc.
Automated data modeling to quickly build dashboards without coding.
Interactive analysis and reporting to spot patterns, trends and insights in data.
Built-in alerting to notify designated teams about critical changes.
Role-based access and permissions to securely share dashboards.
Scheduled dashboard refreshes and exports to regularly review updated KPIs.
White label analytics to rebrand dashboards with company logo and colors.
Datapine is well-suited for businesses looking for easy self-service BI and analytics to empower teams with data-driven insights without massive IT or data warehousing investment. It provides an intuitive, guided interface to rapidly connect and model data sources and design customized dashboards.
Datapine Features
Features
Drag-and-drop interface to create dashboards
Connects to various data sources like SQL, NoSQL, Excel, etc
Interactive visualizations like charts, graphs, maps, gauges
Collaboration tools to share insights across teams
Microsoft Power BI is a powerful business analytics service developed by Microsoft. It empowers users to transform raw data into meaningful insights, create interactive reports and dashboards, and share data-driven stories within an organization. Power BI is designed to help businesses and individuals make informed decisions based on a comprehensive...
Tableau is a leading business intelligence and data visualization platform used by organizations of all sizes to transform their data into easy-to-understand visualizations and dashboards. With Tableau, users can connect to a wide range of data sources, prepare and clean the data for analysis, and create interactive data visualizations such...
Looker Studio is a business intelligence and analytics platform designed to help companies analyze data and gain valuable insights. It provides an intuitive, web-based interface that enables users without technical skills to explore, visualize and share data easily.Some key capabilities and benefits of Looker Studio include:Interactive dashboards - Users can...
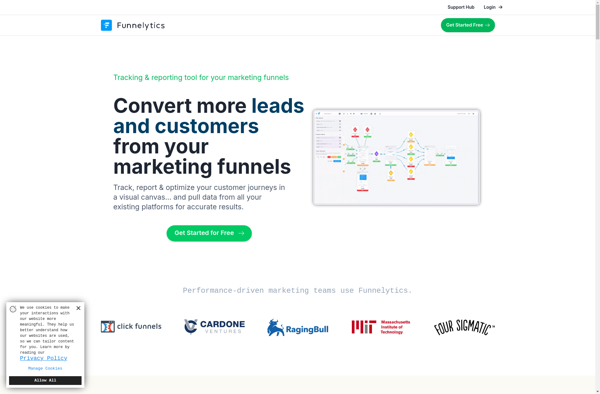
Funnelytics is a comprehensive marketing analytics platform designed to help businesses visualize and optimize their conversion funnels and customer journeys. It integrates data from multiple sources like websites, ads, CRM systems, etc. to create a single customer view.Key features of Funnelytics include:Interactive conversion funnel analysis to identify sticking points and...
Pentaho is a comprehensive open source business intelligence (BI) suite that provides a range of data integration, analytics, visualization, reporting, data mining, and workflow capabilities. It is designed to help businesses consolidate data from disparate sources for unified analytics and reporting.Some of the key capabilities and components of Pentaho include:Data...
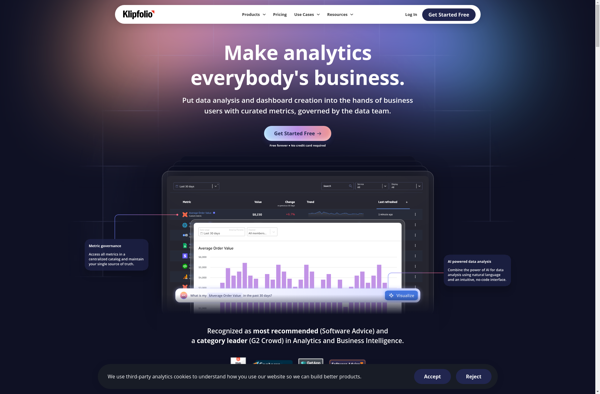
Klipfolio PowerMetrics is a flexible, cloud-based business intelligence and data visualization platform designed to help businesses gain insights from their data. Some key features include:Customizable dashboards - Users can build interactive dashboards with charts, graphs, tables, images and more to visualize key data.Real-time data connectivity - Connect to cloud apps,...
Google Fusion Tables is a cloud-based service designed for working with structured data. It allows users to upload, host, manage, share, visualize and collaborate on tabular datasets. Some of the key features of Google Fusion Tables include:Data importing from various formats like CSV, KML, spreadsheetsData exporting to formats like CSV...
Snapboard is an online visual collaboration software used by teams for brainstorming, organizing workflows, managing projects, and more. It provides an infinite virtual whiteboard where users can add sticky notes, images, freehand drawings, and diagrams to capture ideas and map out plans.Key features of Snapboard include:Infinite canvas for adding unlimited...
Redash is an open-source business intelligence and data visualization web application. It allows users to connect to multiple data sources including SQL databases, query and visualize the data, and create interactive dashboards to share insights.Some key features of Redash:Connect to data sources like PostgreSQL, MySQL, SQL Server, Redshift, BigQuery and...
Amazon QuickSight is a fast, cloud-powered business intelligence service that makes it easy to build visualizations, perform ad-hoc analysis, and quickly get business insights from your data. Some key features include:Intuitive visual interface that makes it easy to visualize and explore dataBroad data connectivity to connect to data sources like...
Vizydrop is a comprehensive graphic design and video editing software suitable for entrepreneurs, small business owners, marketers, social media managers, students, and anyone who needs to create visual content.With its drag-and-drop interface, Vizydrop makes graphic design and video creation accessible even for beginners. It has various templates and assets that...
Knowi is a business intelligence and analytics software that provides tools for data visualization, reporting, and dashboard creation. It allows non-technical users to easily access, analyze, and visualize data without needing to know SQL or coding.Some key features of Knowi include:Drag-and-drop interface to build interactive dashboards, charts, reports and visualizationsBroad...
Marple is an open-source, Markdown-based slide deck tool for creating presentations. It provides a minimalistic editor interface to write slide content in Markdown format, which then gets rendered into an elegant slide deck for presenting.Some key features of Marple:Write slide content in easy-to-read and write Markdown format. Format headings, lists,...
Slemma is an open-source alternative to Grammarly that provides AI-powered grammar and spelling correction for your writing.With Slemma, you can paste in any text and it will analyze it using natural language processing to find typos, grammatical mistakes, and other writing issues. As you type or edit text, Slemma underlines...
GoodData is a business intelligence and analytics platform used by companies to collect, store, and analyze their data to drive business decisions. Some key capabilities and features of GoodData include:Data warehousing and ETL - GoodData ingests data from various sources, transforms it, and loads it into a cloud data warehouse...
InAppBI is a business intelligence and analytics platform specifically designed for gathering insights from web and mobile applications. It allows developers to instrument their apps to capture event data and user behavior, which is processed by the InAppBI platform to generate interactive analytics dashboards and reports.Key capabilities and benefits of...
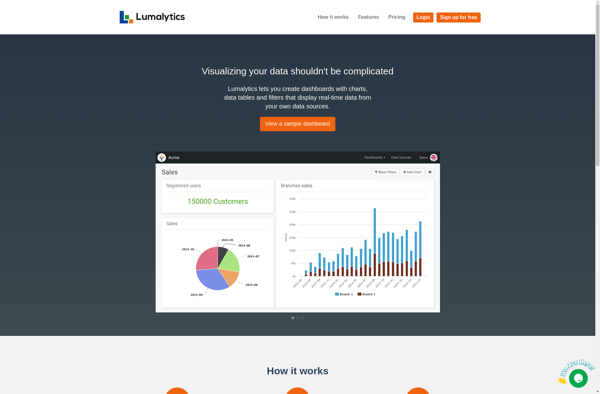
Lumalytics is a software platform built to provide analytics and business intelligence solutions tailored for the logistics industry. It focuses on connecting disparate data sources across the supply chain to give logistics companies enhanced visibility and actionable insights.Key features of Lumalytics include:Shipment tracking & visibility - Real-time tracking of shipments...
Jolicharts is a feature-rich JavaScript charting library that allows you to easily add interactive charts and graphs to web applications and dashboards. With Jolicharts, you can create over 30 types of charts including line charts, bar charts, pie charts, scatter plots, stacked bar charts and more.Some key features of Jolicharts...
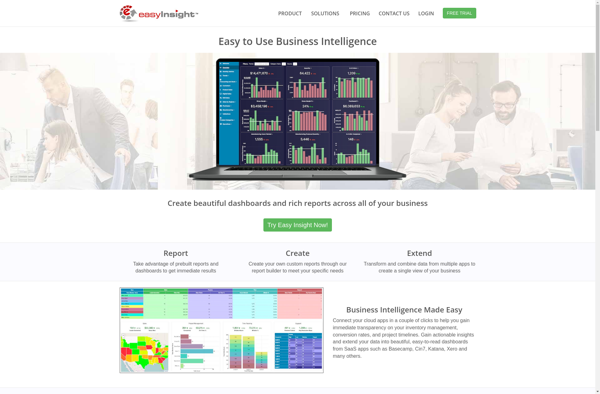
Easy Insight is a business intelligence and data analytics solution built specifically for small and medium-sized enterprises. It enables companies to connect data from multiple sources, build interactive reports and dashboards, and gain actionable insights to optimize business performance.Some key features of Easy Insight include:Intuitive drag-and-drop interface for self-service analyticsPre-built...
Bilbeo Analytics is a leading web analytics software designed to help businesses understand customer behavior and optimize conversion rates. It provides in-depth analysis through interactive dashboards, reports, and visualizations of key metrics like traffic sources, page views, conversions, and more.Some key features of Bilbeo Analytics include:Customizable dashboards - Build interactive...
DrillDb is an open-source distributed SQL query engine for big data. It was originally developed by MapR and is now managed by the Apache Software Foundation. DrillDb allows users to analyze a variety of NoSQL databases and file systems without requiring them to structure the data upfront.Some key features and...