Redash is an open source business intelligence and data visualization tool. It allows you to connect to data sources like databases, query and visualize the data, and create interactive dashboards. Redash makes it easy to share insights with others.
Redash: Open Source Business Intelligence & Data Visualization Tool
Connect to databases, query and visualize data, create interactive dashboards, and share insights with others - Redash is a powerful open source business intelligence solution.
What is Redash?
Redash is an open-source business intelligence and data visualization web application. It allows users to connect to multiple data sources including SQL databases, query and visualize the data, and create interactive dashboards to share insights.
Some key features of Redash:
Connect to data sources like PostgreSQL, MySQL, SQL Server, Redshift, BigQuery and more
Write SQL queries visually or with code editor
Create charts, tables, pivots and other visualizations
Build interactive dashboards with filters, parameters and sharing capabilities
Schedule refresh of queries and dashboards
Collaborate with data teams via dashboard commenting and slack/telegram integrations
Granular user access control and permissions
On-premises and cloud deployment options
Redash is designed for ease of use so that business users, analysts and engineers can self-serve access to company data. The interactive dashboards make it simple to understand key data and trends. The flexible data connections and governance features also make Redash a solid choice for organizations with sensitive data looking to democratize data access responsibly.
Redash Features
Features
Connect to data sources like PostgreSQL, MySQL, Redshift, Google BigQuery, etc.
Grafana is a feature-rich, open source analytics and monitoring visualization suite. It integrates tightly with a variety of database technologies like Graphite, Prometheus, InfluxDB, Elasticsearch, and more to allow for easy exploration and visualization of time series data. Some key capabilities and benefits of Grafana include:Intuitive graphical UI makes it...
Microsoft Power BI is a powerful business analytics service developed by Microsoft. It empowers users to transform raw data into meaningful insights, create interactive reports and dashboards, and share data-driven stories within an organization. Power BI is designed to help businesses and individuals make informed decisions based on a comprehensive...
Tableau is a leading business intelligence and data visualization platform used by organizations of all sizes to transform their data into easy-to-understand visualizations and dashboards. With Tableau, users can connect to a wide range of data sources, prepare and clean the data for analysis, and create interactive data visualizations such...
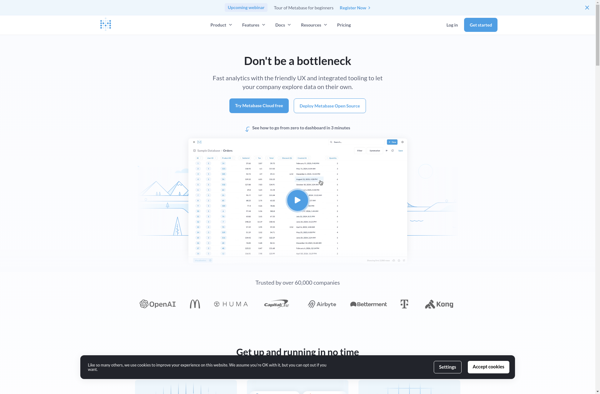
Metabase is an open source business intelligence platform and analytics tool. It allows anyone on a team to ask questions about their data, explore it, and share insights with others through easy-to-create dashboards, charts, and visualizations. Metabase provides an intuitive frontend interface so users can get answers and discover trends...
Looker Studio is a business intelligence and analytics platform designed to help companies analyze data and gain valuable insights. It provides an intuitive, web-based interface that enables users without technical skills to explore, visualize and share data easily.Some key capabilities and benefits of Looker Studio include:Interactive dashboards - Users can...
Google Fusion Tables is a cloud-based service designed for working with structured data. It allows users to upload, host, manage, share, visualize and collaborate on tabular datasets. Some of the key features of Google Fusion Tables include:Data importing from various formats like CSV, KML, spreadsheetsData exporting to formats like CSV...
Snapboard is an online visual collaboration software used by teams for brainstorming, organizing workflows, managing projects, and more. It provides an infinite virtual whiteboard where users can add sticky notes, images, freehand drawings, and diagrams to capture ideas and map out plans.Key features of Snapboard include:Infinite canvas for adding unlimited...
SAP BusinessObjects is a comprehensive business intelligence and analytics software suite from SAP. It brings together capabilities for reporting, analysis, dashboards, data visualization, data discovery, and more to help organizations unlock value from their data.Key capabilities and components of SAP BusinessObjects include:Centralized semantic layer for consistent data across the organizationPowerful...
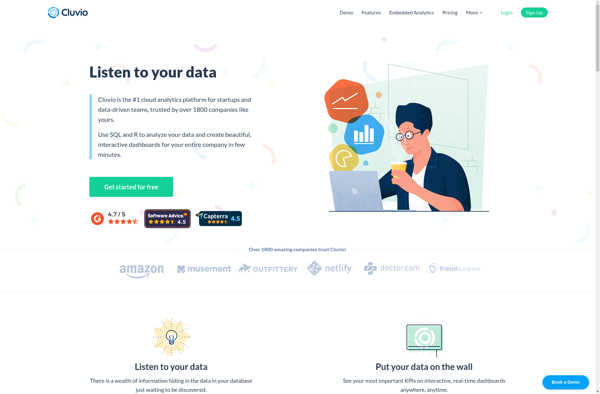
Cluvio is a business intelligence and analytics software designed for small and medium-sized businesses. It aims to make data analytics accessible to non-technical users through an intuitive graphical interface. Some key capabilities and benefits of Cluvio include:Interactive dashboards - Users can create customizable dashboards to visualize important business metrics and...
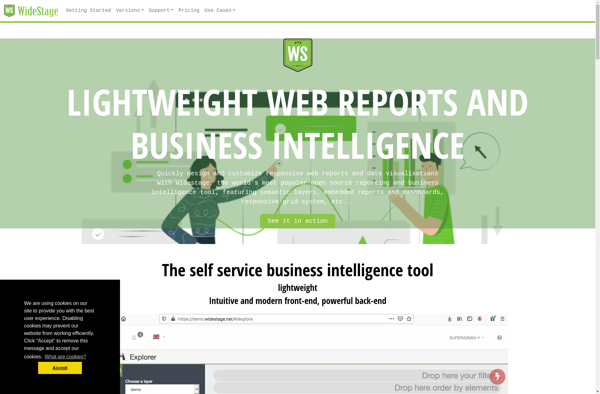
Widestage is an enterprise-grade platform for live video streaming, webinars, and webcasts. It enables businesses, event organizers, education institutions and media publishers to easily broadcast content in real-time to engage with their audience.Key features of Widestage include:Intuitive dashboards for managing live events, presenters, registration, and branding.Robust viewing portal allowing viewers...
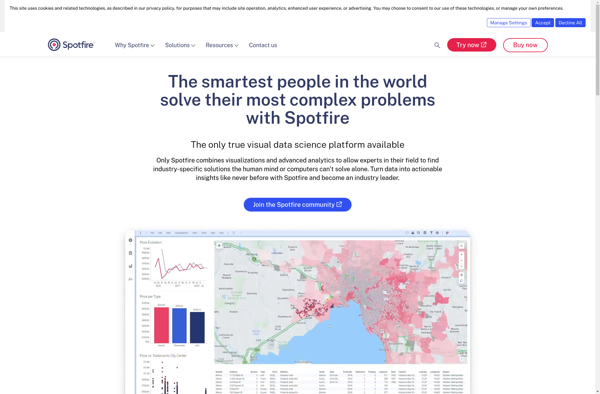
Spotfire is a business intelligence and analytics software platform designed for interactive data discovery and visualization. It enables rapid analysis of large, complex data sets to uncover deeper insights.Key features of Spotfire include:Interactive dashboards and visualizations - Drag-and-drop interface to create customized data visualizations like heat maps, charts, graphs, and...
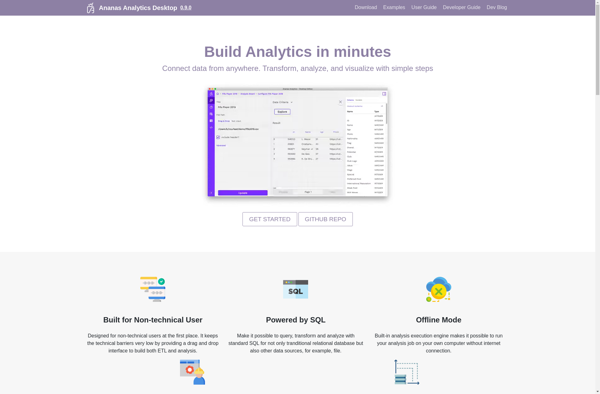
Ananas Desktop is an open-source desktop environment and application suite for Linux and BSD operating systems. Developed as a fork of the Razor-qt project, Ananas aims to provide a lightweight yet fully-featured desktop experience with a focus on speed, stability, and customizability.Some key features of Ananas Desktop include:Lightweight and fast...
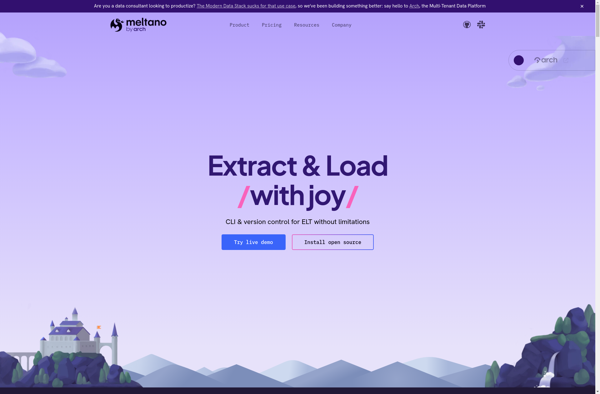
Meltano is an open source data integration and ELT (extract, load, transform) platform aimed at helping data engineers and analysts more easily move, transform, and load data from various sources into data warehouses or visualization platforms. Features include:Visual interface for building data pipelines by connecting data sources, adding transformations, scheduling...
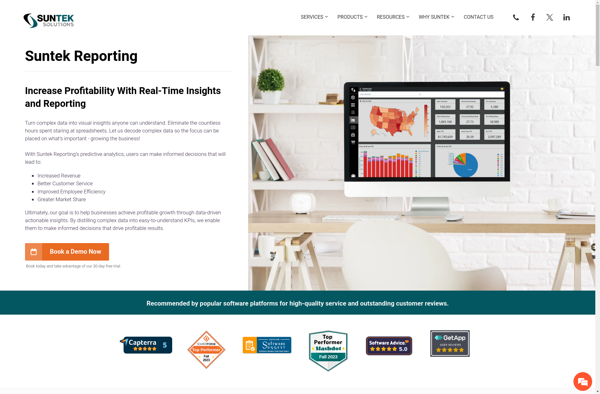
Suntek Reporting is a flexible business intelligence and reporting solution designed to help companies gain better insights from their data. Some key features include:Intuitive drag-and-drop interface to build reports and dashboards quickly without codingConnectivity to a wide range of data sources including SQL Server, MySQL, Oracle, AWS, and morePowerful data...
Sisense is a business intelligence and data analytics software platform designed to help non-technical users prepare, analyze and visualize complex data. Some key features of Sisense include:Intuitive drag-and-drop interface for building interactive dashboards and visualizations like charts, graphs and pivot tables without coding.Ability to connect to wide variety of data...
Chartio is a cloud-based business intelligence and data visualization platform designed to help companies analyze data and share actionable insights. It allows users to connect a variety of data sources including databases, cloud apps, and spreadsheets, and build interactive dashboards and charts.Key features of Chartio include:Intuitive drag and drop interface...
LightCat is an emerging open-source password manager that allows users to securely store website logins, credit card numbers, identities, and other sensitive information behind one master password. It utilizes strong AES-256 bit encryption to protect user data and ensures information is accessible only to the owner.Some key features of LightCat...
Amazon QuickSight is a fast, cloud-powered business intelligence service that makes it easy to build visualizations, perform ad-hoc analysis, and quickly get business insights from your data. Some key features include:Intuitive visual interface that makes it easy to visualize and explore dataBroad data connectivity to connect to data sources like...
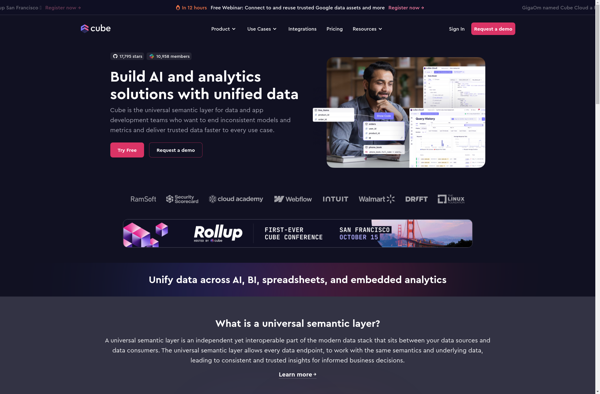
Cube.js is an open-source analytics framework for building cloud-native business intelligence dashboards and applications. It provides a flexible way to analyze and visualize data by generating a data model on top of data warehouses or databases.Some key capabilities and benefits of Cube.js include:Auto-generating a data schema to power analystics dashboards...
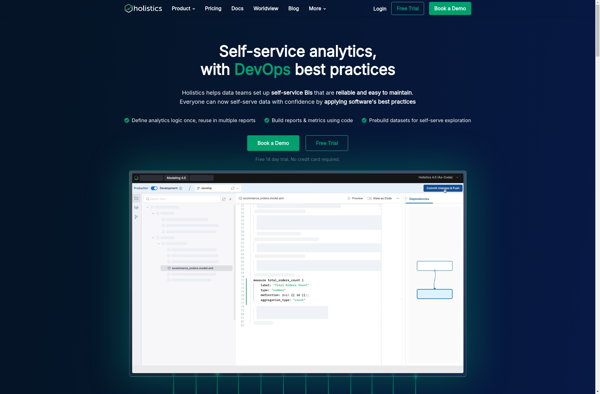
Holistics is an AI-powered unified data platform designed to help companies build and manage their data infrastructure. It provides an intuitive interface for data teams to ingest, prepare, analyze, and visualize data from diverse sources.Key capabilities include:Smart data collection and ingestion from databases, cloud apps, APIs etc.Automated data mapping, cleansing,...
Datapine is an easy-to-use business analytics and dashboard software designed to help businesses visualize, analyze and gain insights from their data. It provides powerful tools to access, clean, unify and model data from multiple sources, including SQL and NoSQL databases, cloud apps, spreadsheets, CSV files and more.Key features of Datapine...
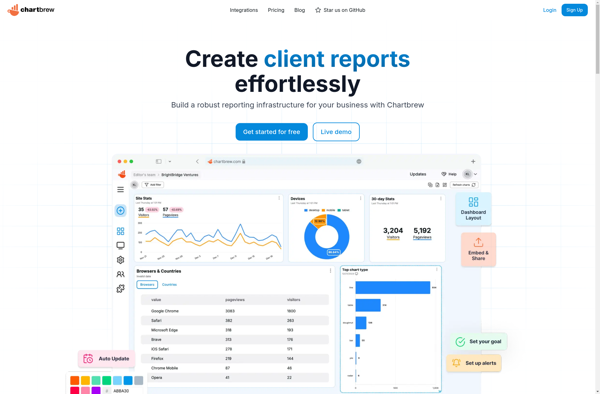
Chartbrew is an open-source business intelligence and data visualization platform used to analyze data and create interactive charts, graphs, and dashboards. It has an easy-to-use drag and drop interface that allows users to connect to SQL, NoSQL, CSV data sources, and SaaS applications to visualize data and find insights.Some key...
The Syncfusion Dashboard Platform is a comprehensive business intelligence and analytics solution designed specifically for data visualization and dashboard creation. It allows you to connect to almost any data source, including SQL databases, Excel files, REST APIs, and more, and transform that data into stunning, interactive dashboards.With an intuitive drag-and-drop...
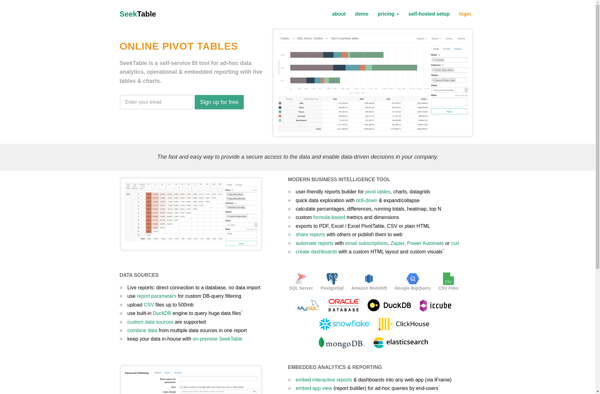
SeekTable is a browser extension and web app that helps you navigate websites more efficiently. It works by outlining tables, charts, and graphs on web pages so you can easily scan, search, and summarize data.Once installed, SeekTable will detect tables, charts, and graphs on a web page and draw red...
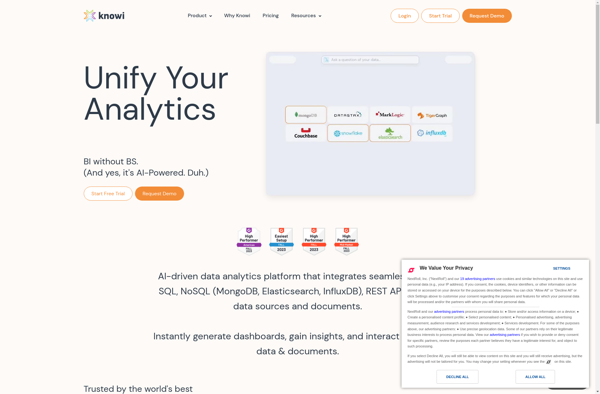
Knowi is a business intelligence and analytics software that provides tools for data visualization, reporting, and dashboard creation. It allows non-technical users to easily access, analyze, and visualize data without needing to know SQL or coding.Some key features of Knowi include:Drag-and-drop interface to build interactive dashboards, charts, reports and visualizationsBroad...
JetPack Data is a comprehensive data management and analytics platform designed to help companies make better use of their data. It provides a suite of tools to ingest, store, analyze, and visualize data from a variety of sources.Key features of JetPack Data include:Flexible data ingestion from databases, cloud apps, files,...
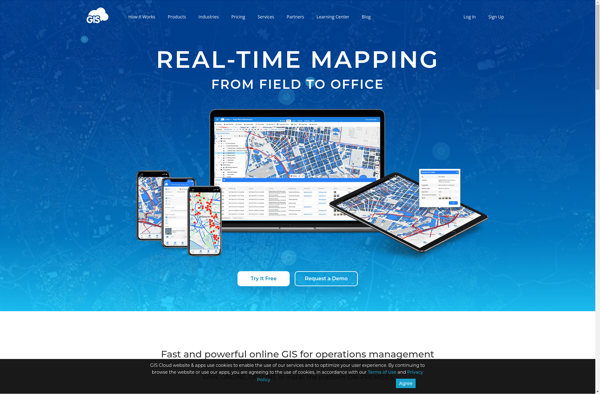
GIS Cloud is a feature-rich, cloud-based geographic information system (GIS) software designed for organizations of all sizes. It enables users to easily create, edit, analyze, and publish geospatial data through an intuitive web interface and mobile apps.Key capabilities and benefits of GIS Cloud include:Interactive web map building with access to...
Draxlr is an open-source project management and collaboration tool similar to Trello. It allows you to create boards containing lists and cards to plan tasks and projects.Some key features of Draxlr include:Custom boards with as many columns and cards as you needDrag-and-drop interface to easily reorder cardsMultiple assigned members per...
Marple is an open-source, Markdown-based slide deck tool for creating presentations. It provides a minimalistic editor interface to write slide content in Markdown format, which then gets rendered into an elegant slide deck for presenting.Some key features of Marple:Write slide content in easy-to-read and write Markdown format. Format headings, lists,...
Stagraph is a powerful yet easy-to-use data visualization and analytics platform designed for modern business needs. As a cloud-based solution, Stagraph enables users to effortlessly map, analyze, and gain actionable insights from even the most complex data sets through intuitive drag-and-drop visualizations.Key capabilities and benefits include:Intelligible and interactive data visualizations...
Cirkulate is an open-source, self-hosted alternative to Google Analytics that allows web developers and site owners to track traffic and analyze usage statistics without compromising visitor privacy. Some key features of Cirkulate include:Lightweight and easy to install. Cirkulate uses a SQLite database and PHP scripts, making it simple to set...
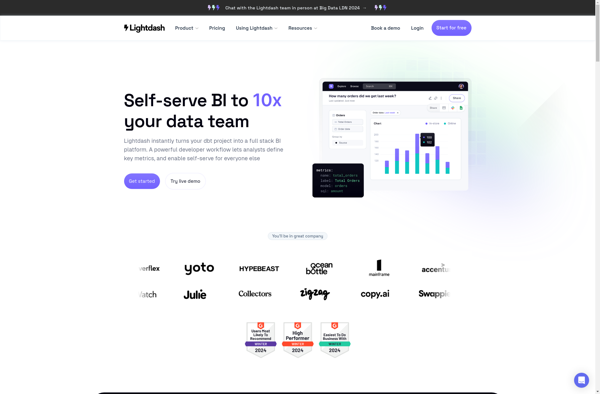
Lightdash is an open-source business intelligence and analytics platform for building interactive dashboards and reports. It allows you to visualize and explore your data to uncover insights and make better decisions.Some key features and capabilities of Lightdash include:Connect to a wide range of data sources like MySQL, PostgreSQL, BigQuery, and...
DataMill is an open-source data catalog and metadata management solution designed to help organizations get more value from their data. Here are some key capabilities:Automated data discovery and cataloging - DataMill crawls data stores like databases, data warehouses, file shares etc. to automatically catalog metadata and make data sets discoverable.Searchable...
Insights for ArcGIS is a powerful cloud-based location analytics solution by Esri for exploring, analyzing, and sharing spatial data through interactive data visualizations. As an all-in-one solution, Insights provides intuitive drag-and-drop tools that empower users of all skill levels to gain deeper insights into their data, identify patterns and trends,...
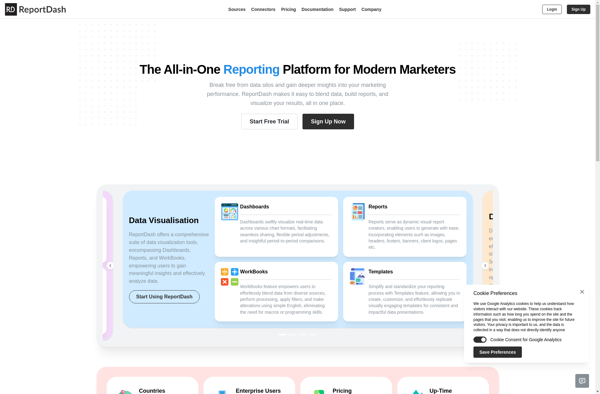
ReportDash is a versatile business intelligence and analytics platform suitable for companies of all sizes. It allows users to connect to various data sources, clean and transform data, and create interactive reports and dashboards that provide actionable insights.Key features include:Intuitive drag-and-drop interface to build reports and dashboards quicklyVariety of customizable...
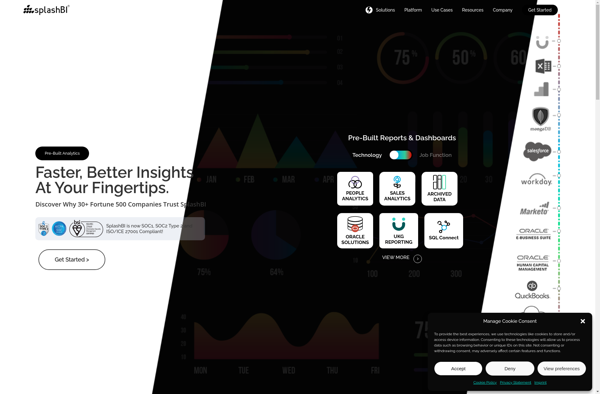
SplashBI is a cloud-based business intelligence and data visualization platform designed for small and medium businesses. Some key features of SplashBI include:Intuitive drag-and-drop interface for building interactive dashboards, charts, tables and reportsLibrary of customizable widgets and visualizations including bar, line and pie chartsAutomated report scheduling and distributionReal-time data connectivity to...
Bime is a flexible business intelligence and analytics platform suitable for modern data teams. It provides an easy way to connect to various data sources like databases, cloud apps, and business software to build interactive dashboards, reports, and analytics.Some key capabilities and benefits of Bime include:Intuitive drag-and-drop interface to visualize...
Mode Analytics is a powerful, cloud-based business intelligence and analytics platform designed to help companies visualize, analyze, and share data to drive better business decisions. With an intuitive drag-and-drop interface, Mode makes it easy for users to connect multiple data sources, build interactive reports and dashboards, and collaborate across teams.Some...
YellowFin is an open-source autoML library for Python that automates the tuning of hyperparameters and model architecture search to help users achieve high accuracy with machine learning models. Developed by researchers at MIT, IIT, and Adobe Research, YellowFin aims to make state-of-the-art machine learning techniques accessible to non-experts.Some key capabilities...
bipp Analytics is a business intelligence and data visualization software that empowers users to connect their data, analyze it visually, and extract meaningful insights. Some key features of bipp Analytics include:Data Connectors - Connect your data from databases, cloud apps, Excel, etc. with pre-built connectors.Interactive Dashboards - Build visually appealing,...
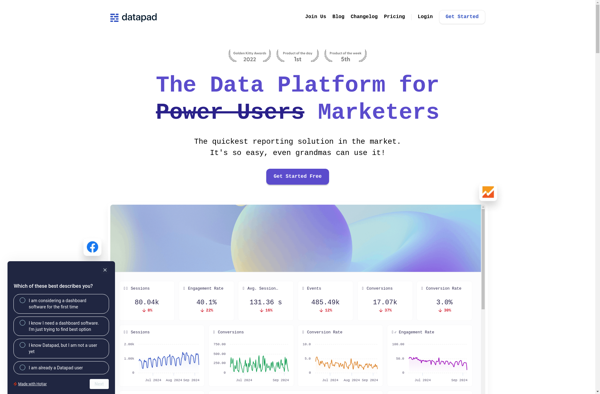
DataPad is a user-friendly data analysis and visualization software designed for researchers of all levels. With its intuitive drag-and-drop interface, DataPad allows users to easily import, clean, analyze and visualize complex datasets without coding.Key features include:Import data from CSV, Excel, databases and other sourcesInteractive drag-and-drop workflow to clean, analyze and...