Cluvio is a business intelligence and data analytics platform designed for smaller companies. It allows non-technical users to access, visualize, and analyze their data without coding. Some key features include interactive dashboards, predictive analytics, scheduled reports, and
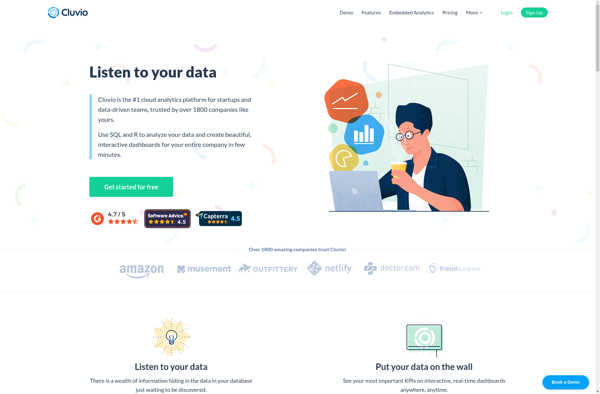
Cluvio: Business Intelligence & Data Analytics for Small Companies
Interactive dashboards, predictive analytics, and more - Cluvio helps non-technical users easily analyze their data without coding.
What is Cluvio?
Cluvio is a business intelligence and analytics software designed for small and medium-sized businesses. It aims to make data analytics accessible to non-technical users through an intuitive graphical interface. Some key capabilities and benefits of Cluvio include:
Interactive dashboards - Users can create customizable dashboards to visualize important business metrics and KPIs. Dashboards update in real-time as new data comes in.
Ad-hoc analysis - Cluvio's drag-and-drop interface allows users to easily filter, segment, and analyze their data on the fly without SQL or coding.
Predictive analytics - The software comes with a library of machine learning models to uncover patterns and predict future outcomes from data.
Scheduled reports and alerts - Users can schedule emails with data visualizations, tables, or PDF exported reports to distribute on a recurring basis.
Connectivity to data sources - Cluvio connects to cloud apps like Google Analytics, MySQL, PostgreSQL, Hubspot and more to unite data.
Role-based access control - Administrators can restrict data access and functionality by user roles.
Full SQL access - For more advanced users that want to write their own SQL queries.
Enterprise-level security - Cluvio leverages industry standard encryption, access controls and data privacy safeguards like GDPR compliance measures.
Designed to be affordable for small companies, Cluvio offers a freemium model with premium plans that scale from $49 to $199 per month. It competes with other BI tools like Tableau, Microsoft Power BI, and Sisense but targets smaller customers with simpler data needs.
Microsoft Power BI is a powerful business analytics service developed by Microsoft. It empowers users to transform raw data into meaningful insights, create interactive reports and dashboards, and share data-driven stories within an organization. Power BI is designed to help businesses and individuals make informed decisions based on a comprehensive...
Tableau is a leading business intelligence and data visualization platform used by organizations of all sizes to transform their data into easy-to-understand visualizations and dashboards. With Tableau, users can connect to a wide range of data sources, prepare and clean the data for analysis, and create interactive data visualizations such...
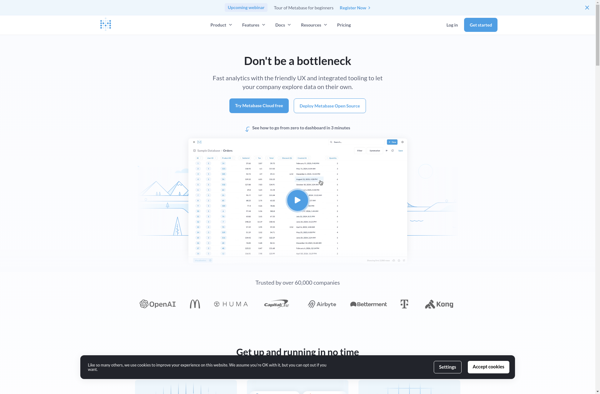
Metabase is an open source business intelligence platform and analytics tool. It allows anyone on a team to ask questions about their data, explore it, and share insights with others through easy-to-create dashboards, charts, and visualizations. Metabase provides an intuitive frontend interface so users can get answers and discover trends...
QlikView is a business intelligence and data visualization platform used to create interactive dashboards and analytics applications. It was first released in 1993 by the Swedish company Qlik. Key features of QlikView include:Associative data modeling and in-memory analytics engine - Allows fast analysis of large, disparate datasets without predefined schema...
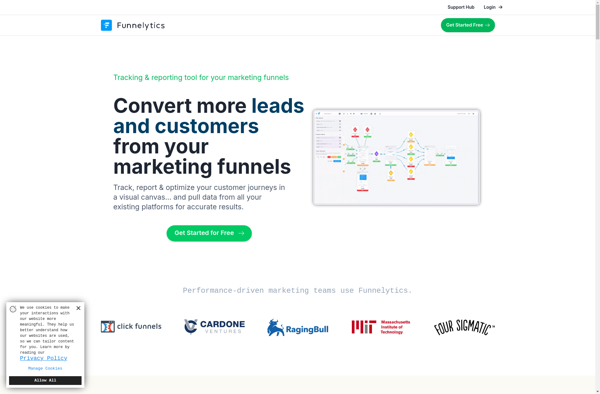
Funnelytics is a comprehensive marketing analytics platform designed to help businesses visualize and optimize their conversion funnels and customer journeys. It integrates data from multiple sources like websites, ads, CRM systems, etc. to create a single customer view.Key features of Funnelytics include:Interactive conversion funnel analysis to identify sticking points and...
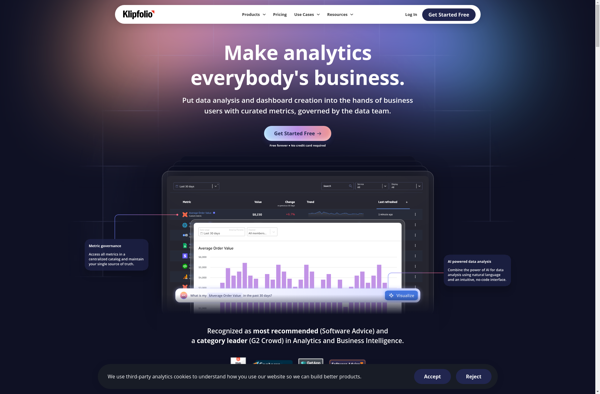
Klipfolio PowerMetrics is a flexible, cloud-based business intelligence and data visualization platform designed to help businesses gain insights from their data. Some key features include:Customizable dashboards - Users can build interactive dashboards with charts, graphs, tables, images and more to visualize key data.Real-time data connectivity - Connect to cloud apps,...
Freeboard is an open-source business intelligence and data visualization software. It provides an intuitive drag-and-drop interface that allows users to visualize data from multiple sources, without needing to code. Some key features of Freeboard include:Connectivity to a variety of data sources like SQL databases, REST APIs, MQTT, and moreLibrary of...
Redash is an open-source business intelligence and data visualization web application. It allows users to connect to multiple data sources including SQL databases, query and visualize the data, and create interactive dashboards to share insights.Some key features of Redash:Connect to data sources like PostgreSQL, MySQL, SQL Server, Redshift, BigQuery and...
Meltano is an open source data integration and ELT (extract, load, transform) platform aimed at helping data engineers and analysts more easily move, transform, and load data from various sources into data warehouses or visualization platforms. Features include:Visual interface for building data pipelines by connecting data sources, adding transformations, scheduling...
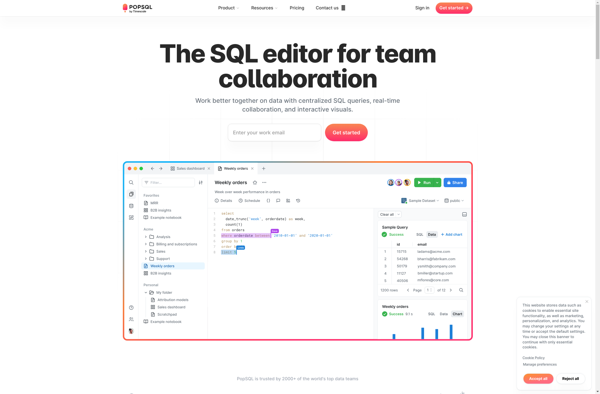
PopSQL is a cloud-based SQL editor that enables teams to collaborate on exploring and analyzing data. It provides an intuitive, browser-based interface for writing queries, visualizing results, and sharing data insights.Key features of PopSQL include:Collaborative editing - Multiple users can query the same datasets, share queries and visualizations, comment, and...
Amazon QuickSight is a fast, cloud-powered business intelligence service that makes it easy to build visualizations, perform ad-hoc analysis, and quickly get business insights from your data. Some key features include:Intuitive visual interface that makes it easy to visualize and explore dataBroad data connectivity to connect to data sources like...
Vizydrop is a comprehensive graphic design and video editing software suitable for entrepreneurs, small business owners, marketers, social media managers, students, and anyone who needs to create visual content.With its drag-and-drop interface, Vizydrop makes graphic design and video creation accessible even for beginners. It has various templates and assets that...
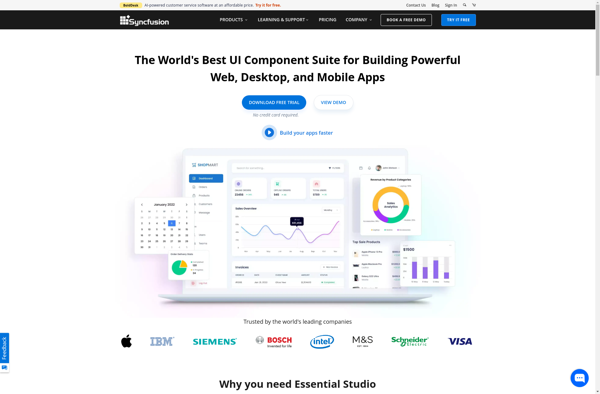
The Syncfusion Dashboard Platform is a comprehensive business intelligence and analytics solution designed specifically for data visualization and dashboard creation. It allows you to connect to almost any data source, including SQL databases, Excel files, REST APIs, and more, and transform that data into stunning, interactive dashboards.With an intuitive drag-and-drop...
Whatagraph is a robust yet easy-to-use data visualization and reporting platform suitable for business users of all backgrounds. With an intuitive drag-and-drop interface, anyone can create interactive dashboards, charts, maps, and graphs that automatically update when data changes.Whatagraph connects directly to data sources like MySQL, PostgreSQL, Excel, Google Sheets, and...
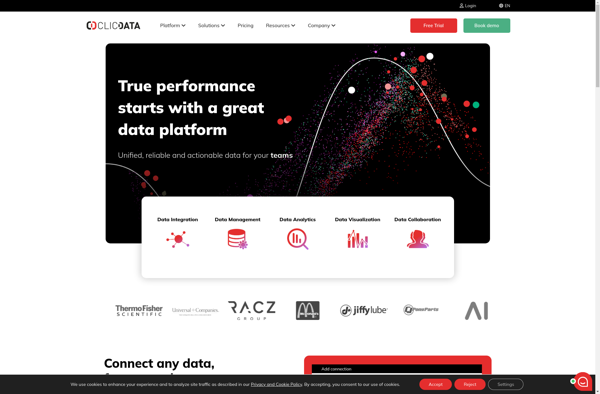
ClicData is a business intelligence and data visualization software designed to help companies make better data-driven decisions. It allows users without technical backgrounds to easily connect to data sources like databases, cloud apps, or Excel files, and build interactive dashboards and reports to gain insights.Some key features of ClicData include:Drag-and-drop...
Marple is an open-source, Markdown-based slide deck tool for creating presentations. It provides a minimalistic editor interface to write slide content in Markdown format, which then gets rendered into an elegant slide deck for presenting.Some key features of Marple:Write slide content in easy-to-read and write Markdown format. Format headings, lists,...
Dasheroo is a comprehensive delivery management platform built specifically for restaurants, ghost kitchens, retail stores, and other businesses that offer delivery services. It streamlines the entire delivery process by providing an easy-to-use dashboard to manage orders, drivers, routes, and customers.Key features of Dasheroo include:- Order management system to handle online...
Teradata is a leading enterprise data warehousing solution designed for large-scale data storage, management, and analysis. It leverages parallel processing and advanced database design to enable high-performance analytics on petabyte-scale data volumes.Some key capabilities and benefits of Teradata include:Massive scalability and storage capacity for storing hundreds of terabytes to petabytes...
Slemma is an open-source alternative to Grammarly that provides AI-powered grammar and spelling correction for your writing.With Slemma, you can paste in any text and it will analyze it using natural language processing to find typos, grammatical mistakes, and other writing issues. As you type or edit text, Slemma underlines...
ClearStory Data is a big data analytics software platform designed to help organizations access, analyze, and collaborate around their rapidly growing volumes and varieties of enterprise data. Some key capabilities include:- Data Harmonization - Ingest, combine, and prepare multiple disparate data sources including structured, multi-structured, and unstructured data.- Fast Data...
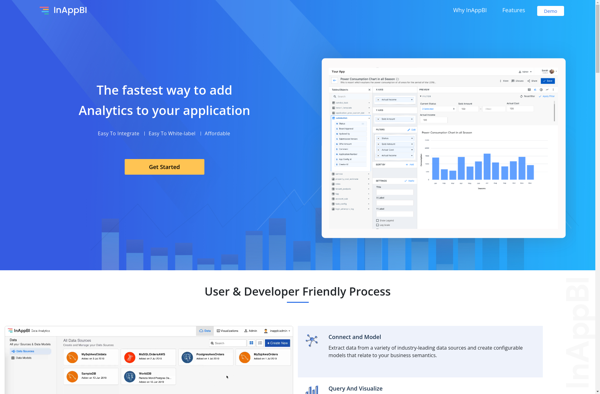
InAppBI is a business intelligence and analytics platform specifically designed for gathering insights from web and mobile applications. It allows developers to instrument their apps to capture event data and user behavior, which is processed by the InAppBI platform to generate interactive analytics dashboards and reports.Key capabilities and benefits of...
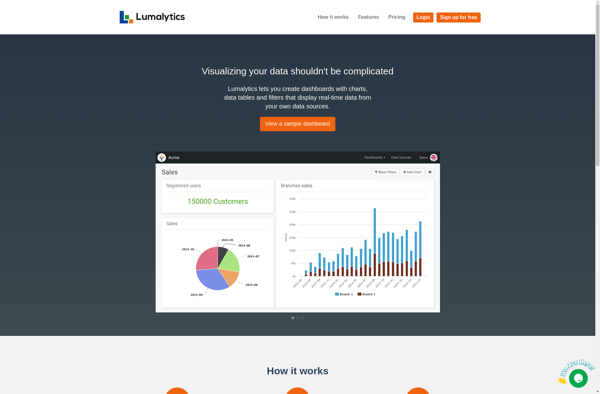
Lumalytics is a software platform built to provide analytics and business intelligence solutions tailored for the logistics industry. It focuses on connecting disparate data sources across the supply chain to give logistics companies enhanced visibility and actionable insights.Key features of Lumalytics include:Shipment tracking & visibility - Real-time tracking of shipments...
Jolicharts is a feature-rich JavaScript charting library that allows you to easily add interactive charts and graphs to web applications and dashboards. With Jolicharts, you can create over 30 types of charts including line charts, bar charts, pie charts, scatter plots, stacked bar charts and more.Some key features of Jolicharts...
FinalBoard is a flexible project management software designed for agile teams. It provides tools to plan projects, break down work into manageable tasks, track progress, and collaborate across teams.Key features of FinalBoard include:Interactive kanban boards to visualize work and track progressCustomizable workflows and automation to match any processFlexible task and...
Bilbeo Analytics is a leading web analytics software designed to help businesses understand customer behavior and optimize conversion rates. It provides in-depth analysis through interactive dashboards, reports, and visualizations of key metrics like traffic sources, page views, conversions, and more.Some key features of Bilbeo Analytics include:Customizable dashboards - Build interactive...