Bilbeo Analytics

Bilbeo Analytics

Bilbeo Analytics is a web analytics software that focuses on data visualization and presentation. It provides interactive dashboards, funnel analysis, cohort analysis, and path analysis to help understand user behavior. The software is easy to use with drag and drop functionality
Bilbeo Analytics image
data-visualization dashboards funnel-analysis cohort-analysis path-analysis user-behavior-analysis

Bilbeo Analytics: Web Analytics Software

Interactive web analytics for data visualization and presentation, with features like funnel analysis, cohort analysis, and path analysis to understand user behavior.

What is Bilbeo Analytics?

Bilbeo Analytics is a leading web analytics software designed to help businesses understand customer behavior and optimize conversion rates. It provides in-depth analysis through interactive dashboards, reports, and visualizations of key metrics like traffic sources, page views, conversions, and more.

Some key features of Bilbeo Analytics include:

  • Customizable dashboards - Build interactive dashboards by dragging and dropping various widgets like metrics, graphs, tables into the layout of your choice.
  • Funnel analysis - Visualize the customer journey across pages and analyze drop off rates to identify optimization opportunities.
  • Cohort analysis - Track groups of users based on shared characteristics to analyze trends over time.
  • Path analysis - See the most common user paths through your website or app to find top conversion funnels.
  • Segment analysis - Break down key metrics by parameters like traffic source, geography, device type and more to gain insights.
  • Real-time stats - Get instant updates on how users are interacting with your site rather than waiting for data to process.
  • Data integrations - Integrate data from platforms like Google Analytics, Facebook, Salesforce and more for complete insights.

Overall, Bilbeo makes it easy for marketers and analysts of all skill levels to get the data they need to make smarter decisions to enhance customer experience and reach business goals.

Bilbeo Analytics Features

Features

  1. Interactive dashboards
  2. Funnel analysis
  3. Cohort analysis
  4. Path analysis
  5. Drag-and-drop report and dashboard building
  6. Data visualization and presentation

Pricing

  • Freemium
  • Subscription-Based

Pros

Easy to use

Comprehensive data analysis features

Visually appealing dashboards

Collaborative reporting

Cons

Limited customization options

Potential performance issues with large datasets

Limited integration with third-party tools


The Best Bilbeo Analytics Alternatives

Top Business & Commerce and Analytics and other similar apps like Bilbeo Analytics


Talend icon

Talend

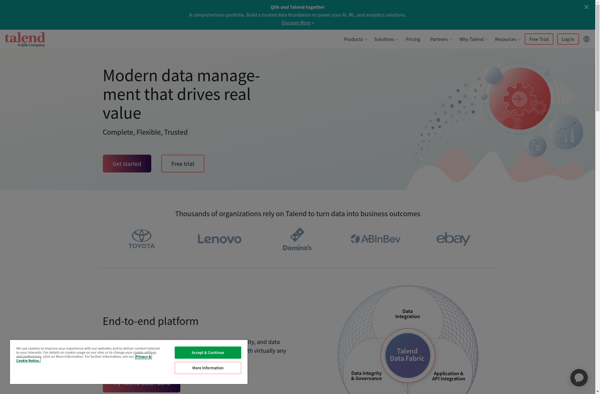
Talend is an open source data integration and management platform designed to help organizations effectively collect, transform, cleanse and share data across systems and teams. Some key capabilities and benefits of Talend include:Graphical drag-and-drop interface to build data integration jobs and workflows without codingOver 900 pre-built data connectors to leading...
Talend image
QlikView icon

QlikView

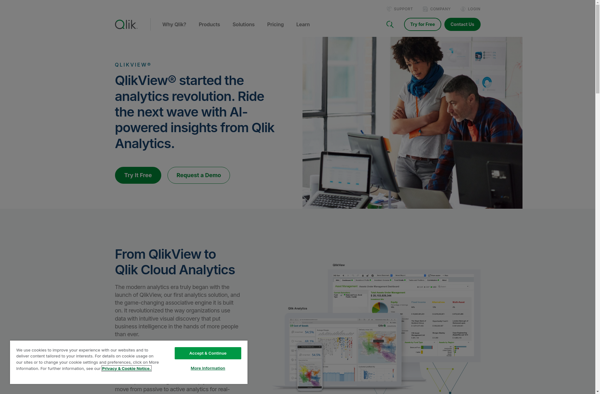
QlikView is a business intelligence and data visualization platform used to create interactive dashboards and analytics applications. It was first released in 1993 by the Swedish company Qlik. Key features of QlikView include:Associative data modeling and in-memory analytics engine - Allows fast analysis of large, disparate datasets without predefined schema...
QlikView image
Funnelytics icon

Funnelytics

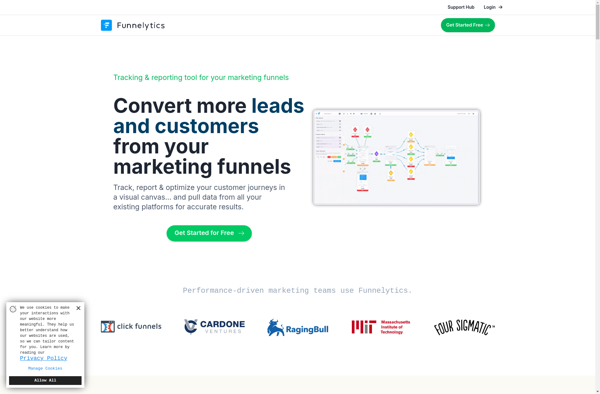
Funnelytics is a comprehensive marketing analytics platform designed to help businesses visualize and optimize their conversion funnels and customer journeys. It integrates data from multiple sources like websites, ads, CRM systems, etc. to create a single customer view.Key features of Funnelytics include:Interactive conversion funnel analysis to identify sticking points and...
Funnelytics image
Klipfolio PowerMetrics icon

Klipfolio PowerMetrics

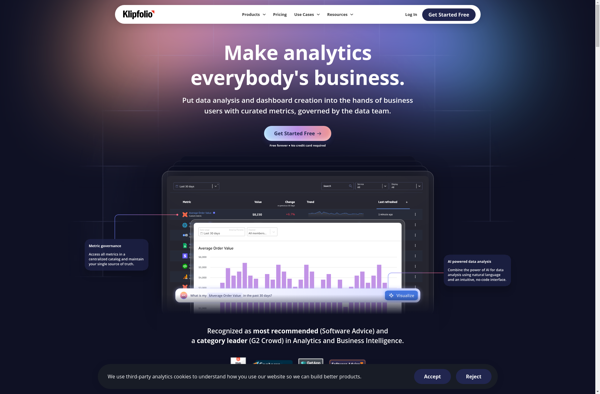
Klipfolio PowerMetrics is a flexible, cloud-based business intelligence and data visualization platform designed to help businesses gain insights from their data. Some key features include:Customizable dashboards - Users can build interactive dashboards with charts, graphs, tables, images and more to visualize key data.Real-time data connectivity - Connect to cloud apps,...
Klipfolio PowerMetrics image
Cluvio icon

Cluvio

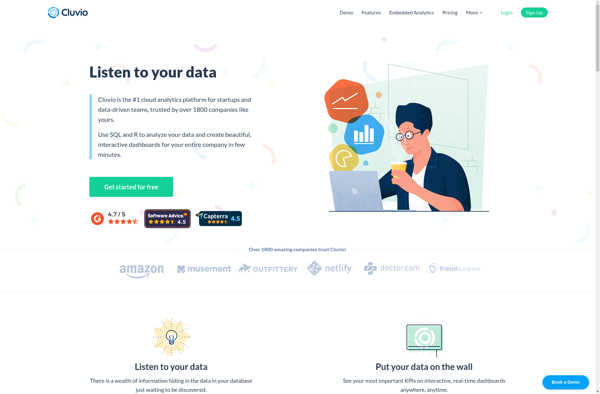
Cluvio is a business intelligence and analytics software designed for small and medium-sized businesses. It aims to make data analytics accessible to non-technical users through an intuitive graphical interface. Some key capabilities and benefits of Cluvio include:Interactive dashboards - Users can create customizable dashboards to visualize important business metrics and...
Cluvio image
Sisense icon

Sisense

Sisense is a business intelligence and data analytics software platform designed to help non-technical users prepare, analyze and visualize complex data. Some key features of Sisense include:Intuitive drag-and-drop interface for building interactive dashboards and visualizations like charts, graphs and pivot tables without coding.Ability to connect to wide variety of data...
Sisense image
Geckoboard icon

Geckoboard

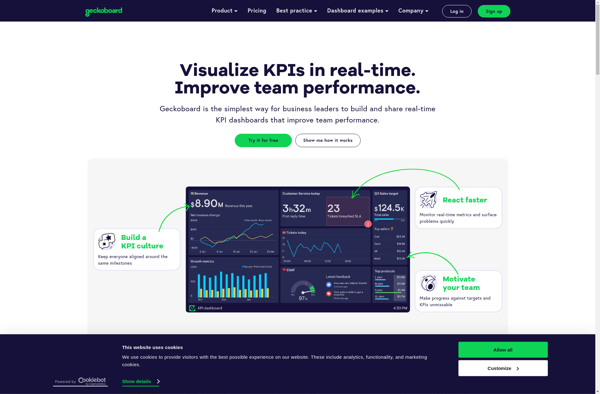
Geckoboard is a cloud-based business intelligence and data visualization platform used by over 30,000 companies worldwide. It allows users to build interactive TV dashboards that bring together data from various sources, both within a company and from external applications, to provide real-time visibility into critical metrics.Geckoboard integrates with 100+ data...
Geckoboard image
DashThis icon

DashThis

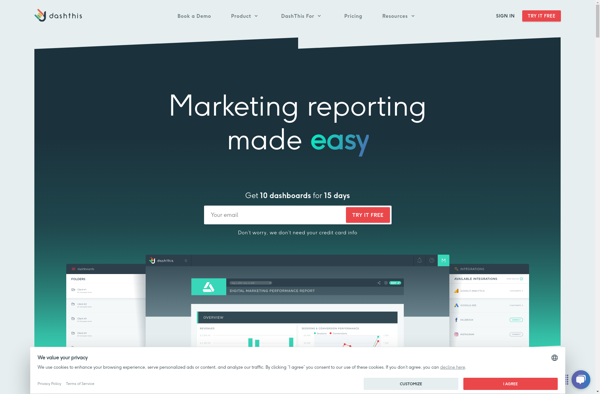
DashThis is a user-friendly project management and task tracking application designed for small teams and businesses. It provides an intuitive interface to plan projects, create tasks, set due dates, assign work to team members, track progress, and collaborate with others.Some key features of DashThis include:Flexible project views - See all...
DashThis image
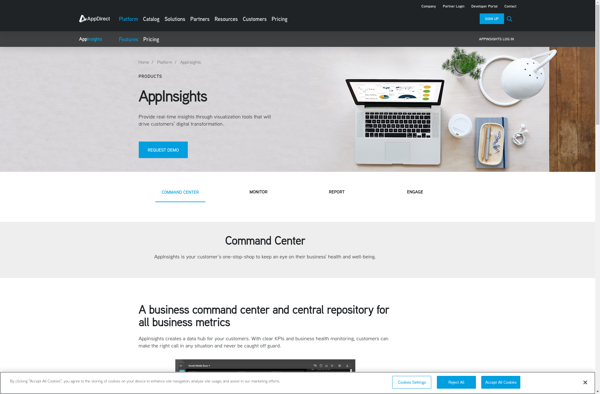
AppInsights icon

AppInsights

AppInsights is an extensive application performance management (APM) service provided by Microsoft Azure. It allows developers to easily monitor their live web applications and track key metrics like response time, failure rates, dependency rates, and more. Some key capabilities of AppInsights:Monitor response time, failure rates, exceptions to identify performance issues...
AppInsights image
Vizydrop icon

Vizydrop

Vizydrop is a comprehensive graphic design and video editing software suitable for entrepreneurs, small business owners, marketers, social media managers, students, and anyone who needs to create visual content.With its drag-and-drop interface, Vizydrop makes graphic design and video creation accessible even for beginners. It has various templates and assets that...
Vizydrop image
Datapine icon

Datapine

Datapine is an easy-to-use business analytics and dashboard software designed to help businesses visualize, analyze and gain insights from their data. It provides powerful tools to access, clean, unify and model data from multiple sources, including SQL and NoSQL databases, cloud apps, spreadsheets, CSV files and more.Key features of Datapine...
Datapine image
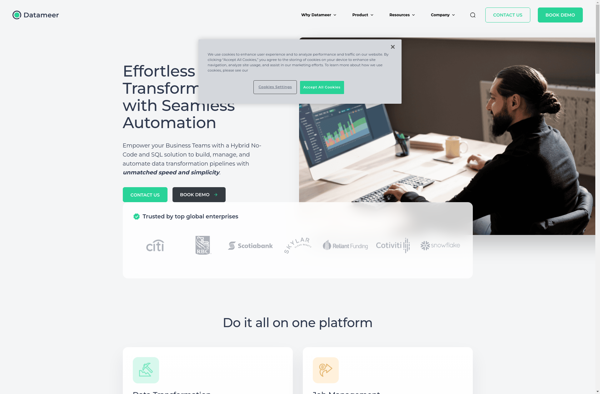
Datameer icon

Datameer

Datameer is an end-to-end data analytics and business intelligence platform built to enable organizations to extract valuable insights from massive datasets from various sources. It simplifies data integration, exploration, and analytics across Hadoop, Spark, cloud platforms, data warehouses, spreadsheets, and more.Key capabilities and benefits of Datameer include:Intuitive spreadsheet-like interface to...
Datameer image
DrillDb icon

DrillDb

DrillDb is an open-source distributed SQL query engine for big data. It was originally developed by MapR and is now managed by the Apache Software Foundation. DrillDb allows users to analyze a variety of NoSQL databases and file systems without requiring them to structure the data upfront.Some key features and...
DrillDb image