Bilbeo Analytics
Description: Bilbeo Analytics is a web analytics software that focuses on data visualization and presentation. It provides interactive dashboards, funnel analysis, cohort analysis, and path analysis to help understand user behavior. The software is easy to use with drag and drop functionality to build reports and dashboards.
Type: software
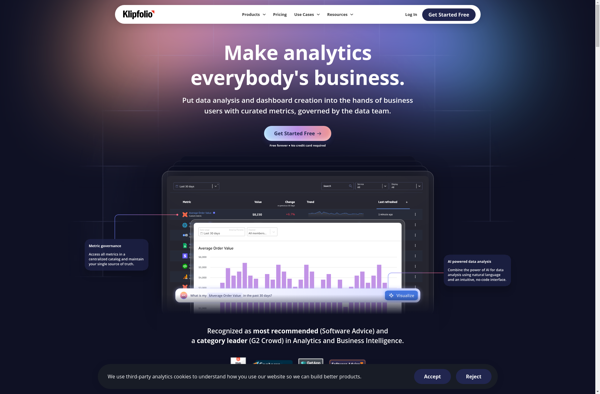
Klipfolio PowerMetrics
Description: Klipfolio PowerMetrics is a business intelligence and data visualization tool that allows users to connect to multiple data sources, create interactive dashboards and share insights. It's known for its flexibility, ease of use and ability to integrate with many applications.
Type: software
Pricing: Subscription