AppInsights

AppInsights

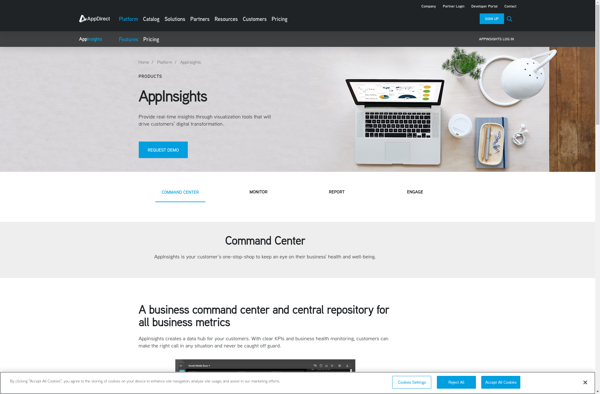
AppInsights is an application performance management (APM) service provided by Microsoft Azure. It is used to monitor live web apps and track metrics like response time, failures, and dependency rates. It provides powerful analytics to identify issues and improve application perf
AppInsights image
monitoring analytics performance

AppInsights: Application Performance Management

AppInsights is an application performance management (APM) service provided by Microsoft Azure. It is used to monitor live web apps and track metrics like response time, failures, and dependency rates. It provides powerful analytics to identify issues and improve application performance.

What is AppInsights?

AppInsights is an extensive application performance management (APM) service provided by Microsoft Azure. It allows developers to easily monitor their live web applications and track key metrics like response time, failure rates, dependency rates, and more. Some key capabilities of AppInsights:

  • Monitor response time, failure rates, exceptions to identify performance issues or errors
  • Set up alerts and get notified when certain events occur, like slow responses or dependency failures
  • Analyze usage trends and statistics to understand user behavior
  • Integrate seamlessly with Azure DevOps to track deployments and monitor their impact
  • Analyze impact of 3rd party dependencies like databases, APIs, etc. on app performance
  • Powerful Analytics with interactive dashboards to filter, correlate events and identify root causes of issues
  • Distributed tracing to monitor complex flows across microservices
  • Built-in AI to proactively detect anomalies and bring attention to issues
  • Integrate with popular development platforms like .NET, Java, Node.js

AppInsights provides rich, actionable data right out of the box with no coding required. It is hugely valuable for developers and teams looking to improve application quality and performance on an ongoing basis.

AppInsights Features

Features

  1. Application Performance Monitoring
  2. Request Tracking
  3. Exception Tracking
  4. Dependency Tracking
  5. Log Analytics
  6. Usage Analytics

Pricing

  • Free
  • Pay-As-You-Go

Pros

Easy integration with Azure

Powerful analytics and dashboards

Alerting and monitoring

Works for wide range of apps

Good value for money

Cons

Can get expensive for large apps

Steep learning curve

Setup can be complex

Advanced features need coding


The Best AppInsights Alternatives

Top Ai Tools & Services and Application Performance Monitoring and other similar apps like AppInsights


Funnelytics icon

Funnelytics

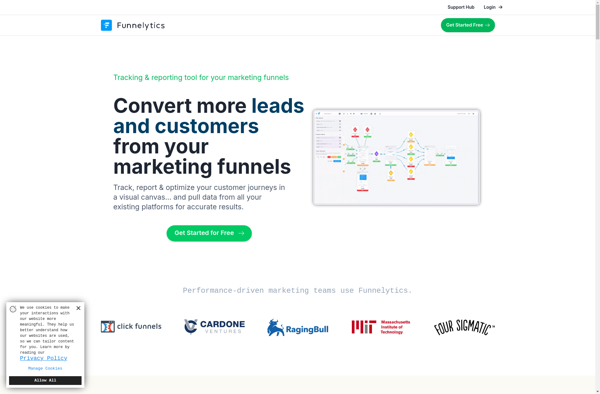
Funnelytics is a comprehensive marketing analytics platform designed to help businesses visualize and optimize their conversion funnels and customer journeys. It integrates data from multiple sources like websites, ads, CRM systems, etc. to create a single customer view.Key features of Funnelytics include:Interactive conversion funnel analysis to identify sticking points and...
Funnelytics image
Cyfe icon

Cyfe

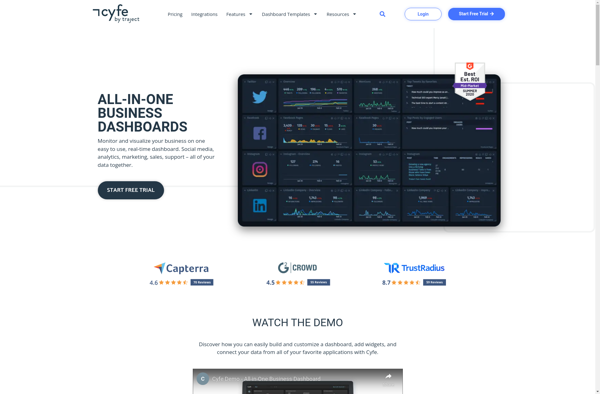
Cyfe is a powerful yet easy-to-use business dashboard and data visualization platform designed to help companies track, analyze, and visualize key performance indicators from all areas of their business. As an all-in-one solution, Cyfe eliminates the need to login to multiple accounts by integrating directly with popular business apps and...
Cyfe image
Cyclotron icon

Cyclotron

Cyclotron is an open-source task management and productivity application for Windows, macOS, and Linux operating systems. It provides users with a flexible framework to organize individual tasks as well as larger projects.Key features of Cyclotron include:Custom categories, tags, milestones, and workflows to categorize tasks and structure projectsCalendar and reminder system...
Cyclotron image
Freeboard icon

Freeboard

Freeboard is an open-source business intelligence and data visualization software. It provides an intuitive drag-and-drop interface that allows users to visualize data from multiple sources, without needing to code. Some key features of Freeboard include:Connectivity to a variety of data sources like SQL databases, REST APIs, MQTT, and moreLibrary of...
SumAll icon

SumAll

SumAll is a cloud-based social media analytics platform designed to help marketers and businesses aggregate and analyze data from multiple social media channels. It pulls metrics from popular platforms like Facebook, Twitter, Instagram, YouTube, and LinkedIn into one centralized dashboard to give users a holistic view of their social media...
Notion Analytics icon

Notion Analytics

Notion Analytics is a business intelligence and data visualization software used by organizations to create visually appealing dashboards connected to various databases and analytics tools. It has an intuitive drag-and-drop interface that enables users to model data and build reports and dashboards without needing to code.Key features of Notion Analytics...
ClicData icon

ClicData

ClicData is a business intelligence and data visualization software designed to help companies make better data-driven decisions. It allows users without technical backgrounds to easily connect to data sources like databases, cloud apps, or Excel files, and build interactive dashboards and reports to gain insights.Some key features of ClicData include:Drag-and-drop...
ClicData image
Dasheroo icon

Dasheroo

Dasheroo is a comprehensive delivery management platform built specifically for restaurants, ghost kitchens, retail stores, and other businesses that offer delivery services. It streamlines the entire delivery process by providing an easy-to-use dashboard to manage orders, drivers, routes, and customers.Key features of Dasheroo include:- Order management system to handle online...
Dasheroo image
Startegy icon

Startegy

Startegy is a comprehensive business strategy software designed to help organizations develop, execute, and manage their strategic plans effectively. It provides a centralized workspace for strategic planning and performance management.Key features of Startegy include:Objectives Management - Set organizational objectives, link them to overarching strategy, assign owners, and track progressStrategy Mapping...
Startegy image
Teradata icon

Teradata

Teradata is a leading enterprise data warehousing solution designed for large-scale data storage, management, and analysis. It leverages parallel processing and advanced database design to enable high-performance analytics on petabyte-scale data volumes.Some key capabilities and benefits of Teradata include:Massive scalability and storage capacity for storing hundreds of terabytes to petabytes...
Teradata image
Everview icon

Everview

Everview is a visual collaboration software designed to simplify the design review and feedback process for teams. It provides a single online space to upload, discuss, and iterate on any visual content, including design files, documents, websites, presentations, and more.Some key features of Everview include:Real-time commenting and annotation tools for...
JSlate icon

JSlate

jSlate is an open-source vector graphics and diagramming web application for creating a wide variety of diagrams and sketches. With its intuitive drag-and-drop interface, jSlate makes it easy for users to construct flowcharts, UML diagrams, user interface mockups, network diagrams, organizational charts, and more.Some key features of jSlate include:Drag-and-drop shapes...
JSlate image
GlimpseDash icon

GlimpseDash

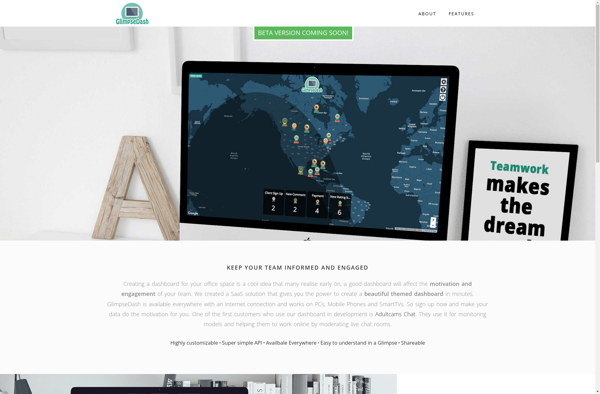
GlimpseDash is a business intelligence and analytics software designed to help companies visualize, analyze, and share data insights. Some key features include:Customizable dashboards with drag-and-drop widget builderHundreds of customizable chart and graph optionsSingle dashboard connected to multiple data sourcesReal-time updates to dashboards as data changesCollaboration tools to share dashboards and...
GlimpseDash image
Dashing icon

Dashing

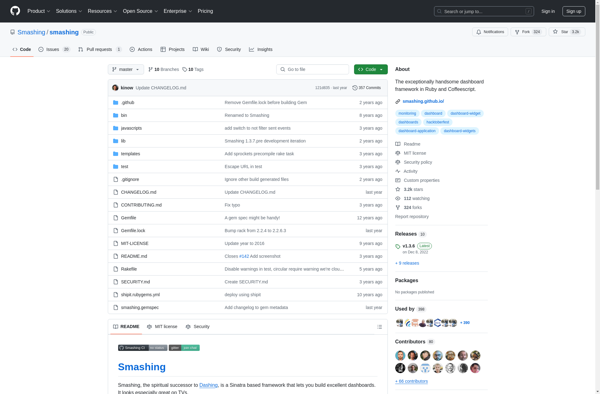
Dashing is an open-source web application dashboard framework that allows developers and non-developers alike to build beautiful, real-time dashboards. It provides a simple way to organize and monitor complex data, making it easy to visualize and share key metrics and insights.Dashing is built on top of the Sinatra web framework...
Dashing image
Hall Monitor icon

Hall Monitor

Hall Monitor is a powerful piece of classroom management software designed specifically for K-12 learning environments. It gives teachers granular control and insight into how students are using devices in the classroom.The core feature set allows educators to monitor all student screens at once through a central dashboard. From there,...
SkyStats icon

SkyStats

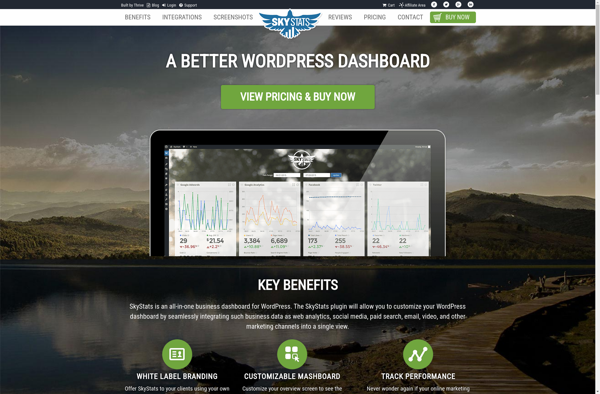
SkyStats is a robust statistics and analytics platform built to provide photographers, creative agencies, and media professionals with deep insights into their business and audience. As an all-in-one solution, SkyStats tracks website traffic, social media engagement, email marketing metrics, online sales, and more to uncover trends and opportunities for growth.Key...
SkyStats image
Quantum.io icon

Quantum.io

Quantum.io is a cloud-based artificial intelligence platform designed to make building and deploying AI solutions faster, easier, and more accessible. The platform includes tools and services for the full AI lifecycle:- Data integration services allow users to securely connect data sources like databases, cloud storage, APIs, and more to Quantum's...
Quantum.io image
CircleBi icon

CircleBi

CircleBI is a flexible business intelligence and analytics platform used by companies to visualize data and uncover insights for better decision making. It provides interactive dashboards, reports, and charts that connect to various data sources like databases, spreadsheets, etc.Key features of CircleBI include:Customizable dashboards to monitor KPIsAd-hoc reporting to quickly...
Ducksboard icon

Ducksboard

Ducksboard is a cloud-based business intelligence and data visualization platform used by companies to monitor key performance indicators and other metrics in real-time. It allows users to create customizable dashboards using a drag-and-drop interface and various widget types like charts, graphs, gauges, tables, and more.Some key features of Ducksboard include:Real-time...
Web Control Room icon

Web Control Room

Web Control Room is a powerful yet easy-to-use web analytics platform designed for small to medium businesses. It gives comprehensive insights into website visitors and traffic sources along with tools to identify qualified leads and optimize conversion funnels.With Web Control Room, businesses can:Track visitors and pageviews to understand website usage...
Web Control Room image
Progress OpenEdge icon

Progress OpenEdge

Progress OpenEdge is a development platform optimized for creating business applications. It includes a 4th generation programming language (4GL) designed for rapid application development along with tools for building user interfaces, reporting, integration, and application management.Key features of Progress OpenEdge include:4GL language for faster coding and reduced maintenance costs compared...
Progress OpenEdge image
Fruit Dashboard icon

Fruit Dashboard

Fruit Dashboard is a powerful, easy-to-use business intelligence and data visualization platform built specifically for the fruit industry. Companies of any size can use Fruit Dashboard to connect data from multiple sources, build interactive dashboards and reports, set metrics and KPIs, and gain valuable insights.With drag-and-drop simplicity, Fruit Dashboard makes...
FinalBoard icon

FinalBoard

FinalBoard is a flexible project management software designed for agile teams. It provides tools to plan projects, break down work into manageable tasks, track progress, and collaborate across teams.Key features of FinalBoard include:Interactive kanban boards to visualize work and track progressCustomizable workflows and automation to match any processFlexible task and...
FinalBoard image
Informly icon

Informly

Informly is a robust customer feedback and product reviews software designed to help companies better understand and act on customer opinions. It includes the following key features:NPS Surveys - Send customized Net Promoter Score surveys via email and SMS to measure customer loyalty.In-App Surveys - Embed feedback forms directly into...
Informly image
Bilbeo Analytics icon

Bilbeo Analytics

Bilbeo Analytics is a leading web analytics software designed to help businesses understand customer behavior and optimize conversion rates. It provides in-depth analysis through interactive dashboards, reports, and visualizations of key metrics like traffic sources, page views, conversions, and more.Some key features of Bilbeo Analytics include:Customizable dashboards - Build interactive...
Bilbeo Analytics image