CircleBI is a business intelligence and analytics platform that provides dashboards, reports, and visualizations to help companies analyze data and make better decisions. It integrates with various data sources and allows easy data exploration.
CircleBI: Business Intelligence Analytics Platforms
CircleBI provides dashboards, reports, and visualizations for data analysis and decision-making, integrating with various data sources for easy exploration.
What is CircleBi?
CircleBI is a flexible business intelligence and analytics platform used by companies to visualize data and uncover insights for better decision making. It provides interactive dashboards, reports, and charts that connect to various data sources like databases, spreadsheets, etc.
Key features of CircleBI include:
Customizable dashboards to monitor KPIs
Ad-hoc reporting to quickly answer business questions
Data exploration tools for slicing and dicing data
Visualizations like charts, graphs, heat maps and more
Collaboration tools to discuss insights with teams
Scheduled and shared reports to distribute to stakeholders
Integration with data warehouses, CRM, support and other systems
Access control to manage user permissions
CircleBI makes it easy for business users to visualize data, share insights and collaborate to make data-driven decisions without needing technical skills. It can be cloud-based or self-hosted on internal servers. Flexible pricing plans are available for small and large teams.
Microsoft Power BI is a powerful business analytics service developed by Microsoft. It empowers users to transform raw data into meaningful insights, create interactive reports and dashboards, and share data-driven stories within an organization. Power BI is designed to help businesses and individuals make informed decisions based on a comprehensive...
Tableau is a leading business intelligence and data visualization platform used by organizations of all sizes to transform their data into easy-to-understand visualizations and dashboards. With Tableau, users can connect to a wide range of data sources, prepare and clean the data for analysis, and create interactive data visualizations such...
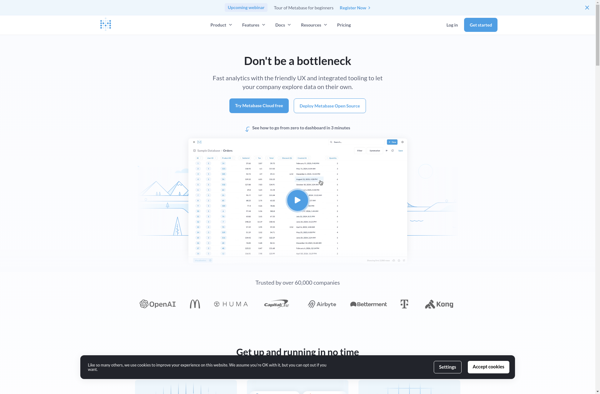
Metabase is an open source business intelligence platform and analytics tool. It allows anyone on a team to ask questions about their data, explore it, and share insights with others through easy-to-create dashboards, charts, and visualizations. Metabase provides an intuitive frontend interface so users can get answers and discover trends...
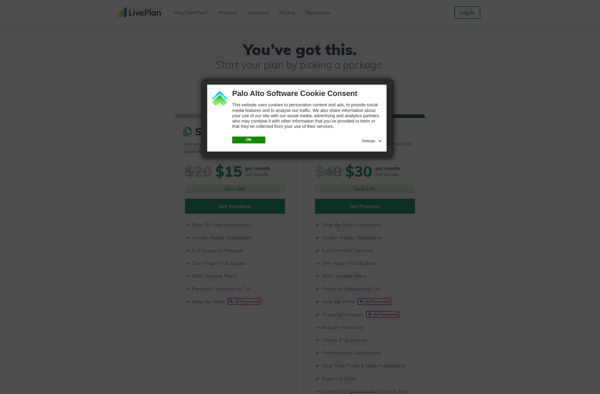
Liveplan is an online business planning software designed to help entrepreneurs craft professional business plans and financial projections. Some key features of Liveplan include:Intuitive web-based interface with drag-and-drop templates for over 500 industriesAutomated financial forecasts and graphs based on inputs and assumptionsInvestor-ready reports, executive summaries, and presentation toolsCollaboration features to...
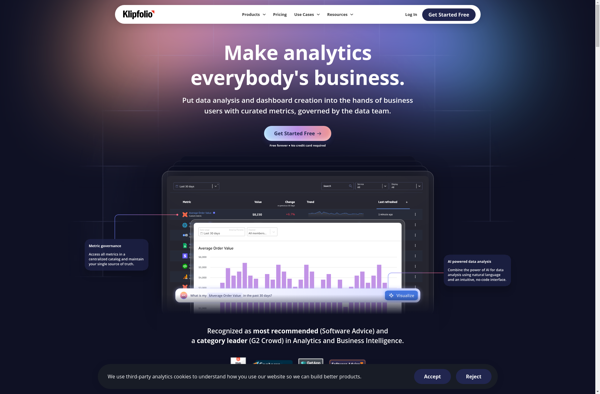
Klipfolio PowerMetrics is a flexible, cloud-based business intelligence and data visualization platform designed to help businesses gain insights from their data. Some key features include:Customizable dashboards - Users can build interactive dashboards with charts, graphs, tables, images and more to visualize key data.Real-time data connectivity - Connect to cloud apps,...
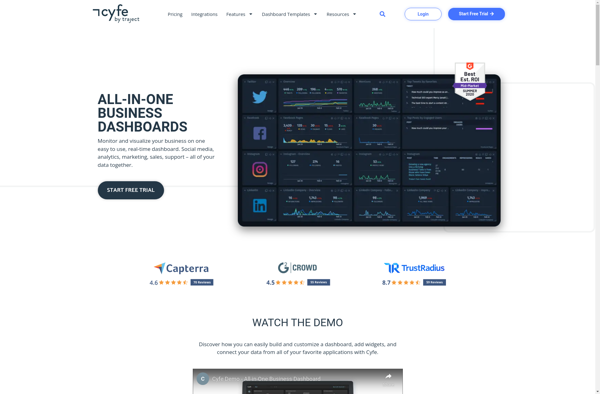
Cyfe is a powerful yet easy-to-use business dashboard and data visualization platform designed to help companies track, analyze, and visualize key performance indicators from all areas of their business. As an all-in-one solution, Cyfe eliminates the need to login to multiple accounts by integrating directly with popular business apps and...
Sisense is a business intelligence and data analytics software platform designed to help non-technical users prepare, analyze and visualize complex data. Some key features of Sisense include:Intuitive drag-and-drop interface for building interactive dashboards and visualizations like charts, graphs and pivot tables without coding.Ability to connect to wide variety of data...
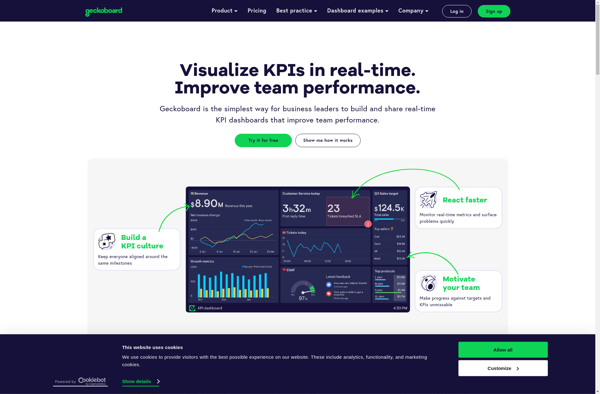
Geckoboard is a cloud-based business intelligence and data visualization platform used by over 30,000 companies worldwide. It allows users to build interactive TV dashboards that bring together data from various sources, both within a company and from external applications, to provide real-time visibility into critical metrics.Geckoboard integrates with 100+ data...
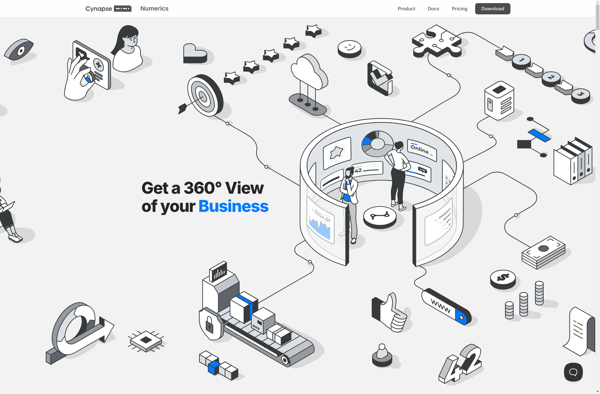
Numerics is an open-source data analysis and visualization application designed for engineering, science, finance, and other domains that work with numeric data. It provides a flexible platform for analyzing, transforming, and visualizing numeric datasets of virtually any size and dimension.Some of the key features and capabilities of Numerics include:Importing and...
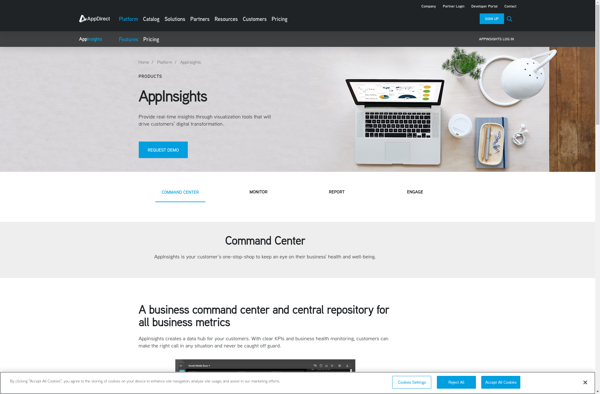
AppInsights is an extensive application performance management (APM) service provided by Microsoft Azure. It allows developers to easily monitor their live web applications and track key metrics like response time, failure rates, dependency rates, and more. Some key capabilities of AppInsights:Monitor response time, failure rates, exceptions to identify performance issues...
Dasheroo is a comprehensive delivery management platform built specifically for restaurants, ghost kitchens, retail stores, and other businesses that offer delivery services. It streamlines the entire delivery process by providing an easy-to-use dashboard to manage orders, drivers, routes, and customers.Key features of Dasheroo include:- Order management system to handle online...