Cyfe

Cyfe: All-in-One Business Dashboard
Cyfe is an all-in-one online business dashboard that allows you to monitor and analyze key business metrics from various services in one centralized location. It integrates with popular tools like Salesforce, QuickBooks, Google Analytics, and more to give you visibility across your entire business.
What is Cyfe?
Cyfe is a powerful yet easy-to-use business dashboard and data visualization platform designed to help companies track, analyze, and visualize key performance indicators from all areas of their business. As an all-in-one solution, Cyfe eliminates the need to login to multiple accounts by integrating directly with popular business apps and services like Salesforce, QuickBooks, Google Analytics, GitHub, MailChimp, Stripe, and Slack.
Once connections are established, Cyfe automatically syncs data from the various services into fully customizable dashboards, allowing you to track real-time metrics as well as historical trends across marketing, sales, finance, support, and more. With interactive charts and graphs, automated alerts, collaboration features, and robust API access, Cyfe aims to help companies gain transparency across business units in order to make better, data-driven decisions.
Positioning itself as an alternative to more complex and expensive BI tools, Cyfe targets small and medium businesses with its intuitive interface, flexible pricing plans, and focus on essential metrics for SMBs. For teams that need to monitor KPIs but may lack dedicated analysts or data visualization expertise, Cyfe strives to provide comprehensive business intelligence in an accessible package.
Cyfe Features
Features
- Real-time dashboard creation
- Pre-built dashboard templates
- Data integration from multiple sources
- Customizable widgets and charts
- Alerts and notifications
- Team collaboration
- Mobile app
- API access
Pricing
- Freemium
Pros
Cons
Official Links
Reviews & Ratings
Login to ReviewThe Best Cyfe Alternatives
View all Cyfe alternatives with detailed comparison →
Top Business & Commerce and Business Intelligence & Analytics and other similar apps like Cyfe
Here are some alternatives to Cyfe:
Suggest an alternative ❐Microsoft Power BI

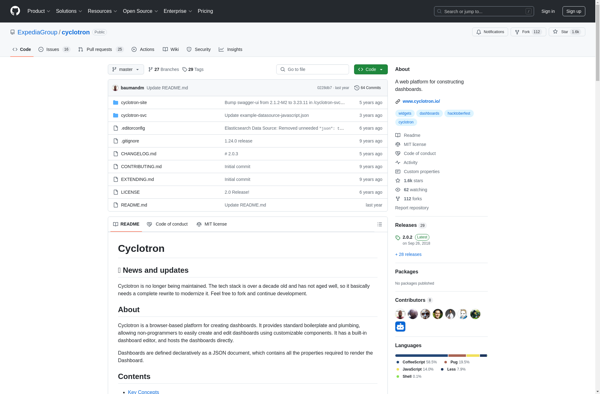
Cyclotron
Freeboard
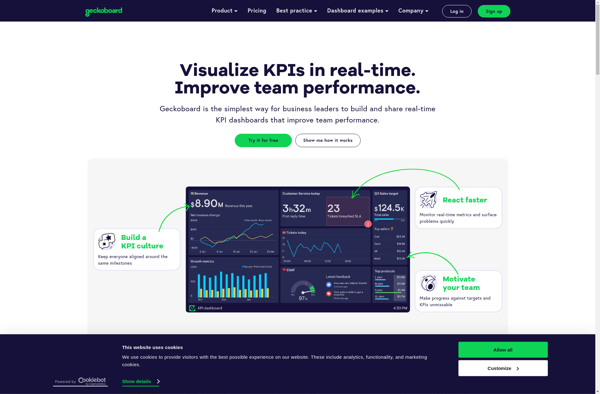
Geckoboard
DashThis

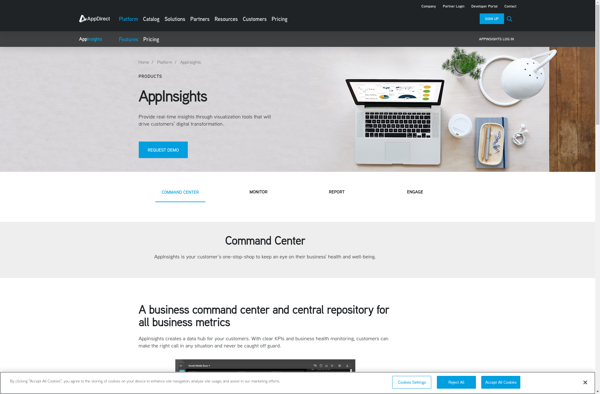
AppInsights
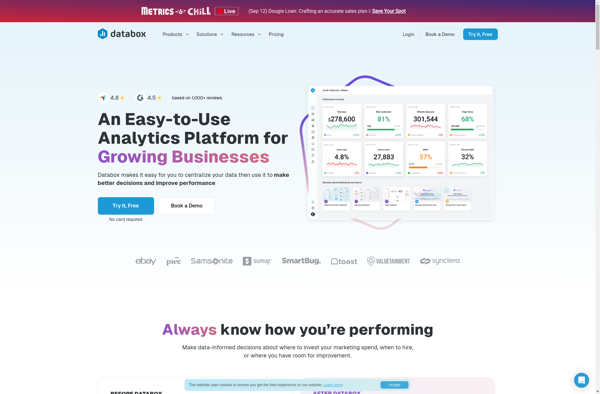
Databox
Whatagraph

Notion Analytics
ClicData
Dasheroo

Startegy
Everview
ReportDash

GlimpseDash

GetBadges
SkyStats

Quantum.io

Traken

CircleBi
Ducksboard
DataHero

Optimo Analytics

Muralio
Oktopus
Fruit Dashboard
Xapsys Live
FinalBoard