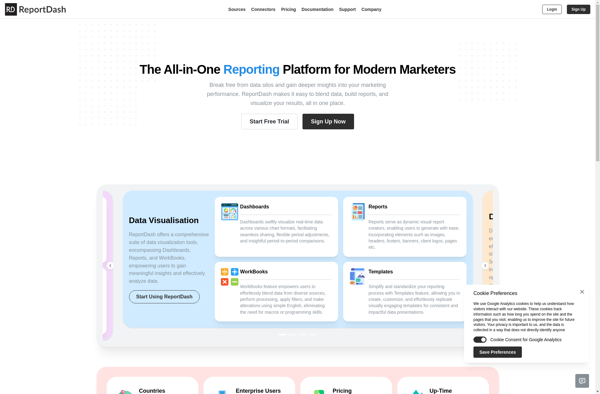
ReportDash is a business intelligence and analytics platform that allows users to create interactive reports and dashboards from their data. It has drag-and-drop functionality to build visualizations quickly without coding.
ReportDash: Business Intelligence and Analytics Platforms
A business intelligence and analytics platform that allows users to create interactive reports and dashboards from their data with drag-and-drop functionality
What is ReportDash?
ReportDash is a versatile business intelligence and analytics platform suitable for companies of all sizes. It allows users to connect to various data sources, clean and transform data, and create interactive reports and dashboards that provide actionable insights.
Key features include:
Intuitive drag-and-drop interface to build reports and dashboards quickly
Variety of customizable widgets like charts, tables, filters, and KPI indicators
Options to schedule and share reports via email or embed them into web pages
Collaborative workspaces for teams to discuss insights
Native connectivity to SQL, MySQL, PostgreSQL, Salesforce and other databases and applications
Robust permission management to control access
Mobile optimization for viewing analyses on the go
With robust analytics capabilities, customization options, and ease-of-use, ReportDash is an ideal platform for companies looking to democratize data access and leverage analytics across their organization.
Google Analytics is a free web analytics service offered by Google that tracks and reports website traffic. It is the most widely used web analytics service on the Internet.Some key features of Google Analytics include:Tracking number of visitors, page views, bounce rate, session duration, demographics, location, behavior and moreIn-depth analysis...
Tableau is a leading business intelligence and data visualization platform used by organizations of all sizes to transform their data into easy-to-understand visualizations and dashboards. With Tableau, users can connect to a wide range of data sources, prepare and clean the data for analysis, and create interactive data visualizations such...
QlikView is a business intelligence and data visualization platform used to create interactive dashboards and analytics applications. It was first released in 1993 by the Swedish company Qlik. Key features of QlikView include:Associative data modeling and in-memory analytics engine - Allows fast analysis of large, disparate datasets without predefined schema...
Plotly is an open-source graphing library that allows users to create interactive, publication-quality graphs, charts, and dashboards. It supports Python, R, JavaScript, and Excel as programming languages. Some key features of Plotly include:Interactive visualization - Plotly charts are interactive with features like hover text, zooming, panning, selectable legends, and editable...
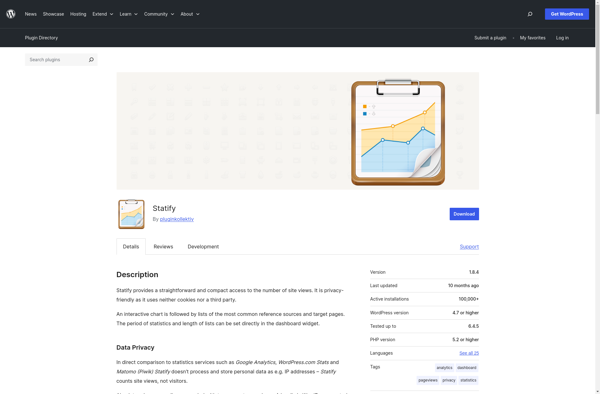
Statify is a user-friendly web analytics platform designed to help website owners, bloggers, and small business owners better understand their website traffic and visitor behavior. Some key features of Statify include:Intuitive dashboards and reports providing actionable insights on website visitors, traffic sources, popular content, and more.Real-time analytics allowing you to...
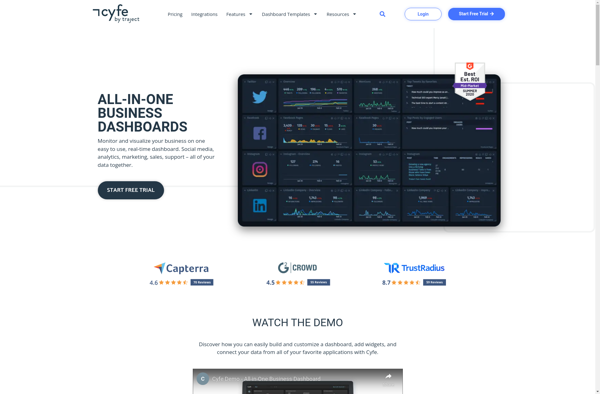
Cyfe is a powerful yet easy-to-use business dashboard and data visualization platform designed to help companies track, analyze, and visualize key performance indicators from all areas of their business. As an all-in-one solution, Cyfe eliminates the need to login to multiple accounts by integrating directly with popular business apps and...
Redash is an open-source business intelligence and data visualization web application. It allows users to connect to multiple data sources including SQL databases, query and visualize the data, and create interactive dashboards to share insights.Some key features of Redash:Connect to data sources like PostgreSQL, MySQL, SQL Server, Redshift, BigQuery and...
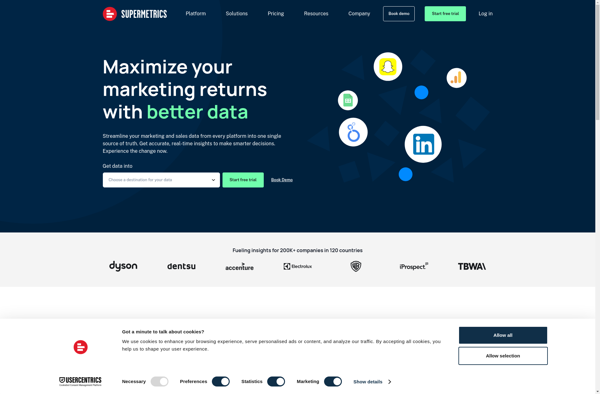
Supermetrics is a powerful marketing analytics software that allows users to connect, analyze and visualize data from a wide variety of sources. It serves as a centralized platform to manage all your marketing data in one place.With Supermetrics, you can connect data sources such as:Google AnalyticsFacebook AdsAdWordsYouTubeLinkedInTwitterMicrosoft AdvertisingSalesforceStripeAnd many moreSome...
Whatagraph is a robust yet easy-to-use data visualization and reporting platform suitable for business users of all backgrounds. With an intuitive drag-and-drop interface, anyone can create interactive dashboards, charts, maps, and graphs that automatically update when data changes.Whatagraph connects directly to data sources like MySQL, PostgreSQL, Excel, Google Sheets, and...
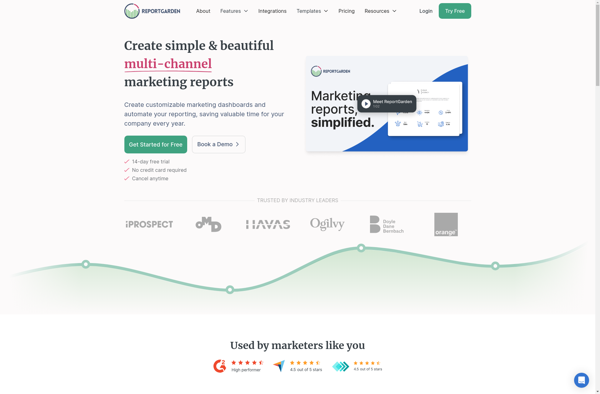
Reportgarden is a business intelligence and data visualization platform designed to help companies make data-driven decisions. It allows users to connect and combine data from multiple sources, including databases, cloud apps, and Excel files, into one centralized location.Some key features of Reportgarden include:Interactive dashboards - Build customizable dashboards with drag-and-drop...
Marple is an open-source, Markdown-based slide deck tool for creating presentations. It provides a minimalistic editor interface to write slide content in Markdown format, which then gets rendered into an elegant slide deck for presenting.Some key features of Marple:Write slide content in easy-to-read and write Markdown format. Format headings, lists,...
Dasheroo is a comprehensive delivery management platform built specifically for restaurants, ghost kitchens, retail stores, and other businesses that offer delivery services. It streamlines the entire delivery process by providing an easy-to-use dashboard to manage orders, drivers, routes, and customers.Key features of Dasheroo include:- Order management system to handle online...
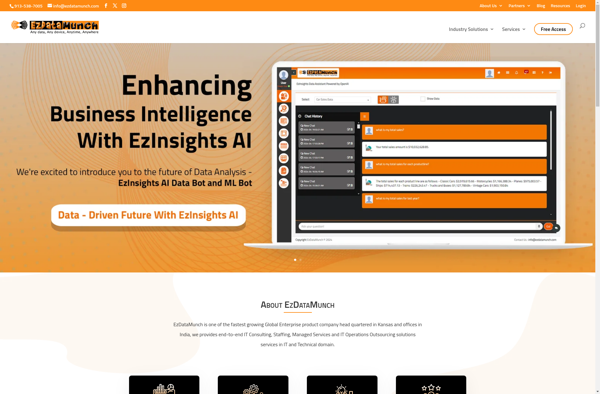
EzDataMunch is a no-code data preparation and analytics platform designed to empower anyone to work with data, regardless of technical skillset. It provides an easy-to-use graphical interface to combine, clean, enrich, and analyze data without the need to write any code.With EzDataMunch, you can connect to various data sources like...
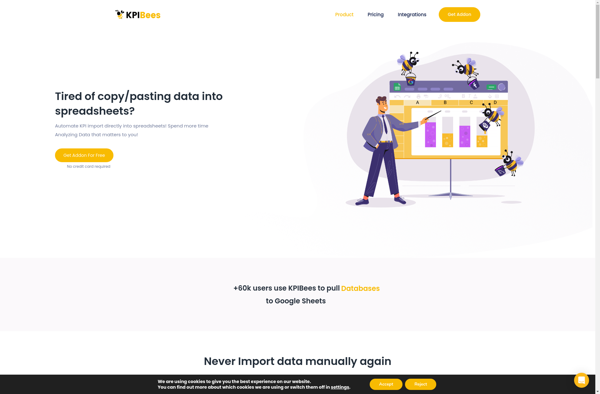
KPIBees is a flexible business intelligence and data visualization platform used by organizations to monitor key performance indicators (KPIs). It provides an easy way to connect various data sources, create customized dashboards with charts/graphs, and share actionable insights across teams.Some key features of KPIBees include:Intuitive drag-and-drop interface to build interactive...
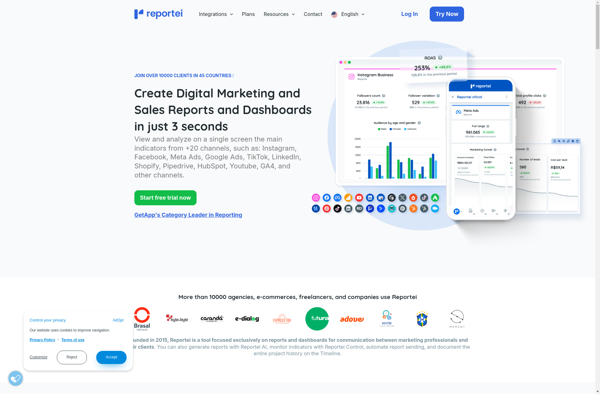
Reportei is an open-source business intelligence and analytics platform used to visualize, analyze and share data through interactive dashboards, reports and graphs. It provides an intuitive drag-and-drop interface that allows non-technical users to easily create rich, interactive reports and dashboards.Some key features of Reportei include:Interactive dashboards with advanced visualizations like...
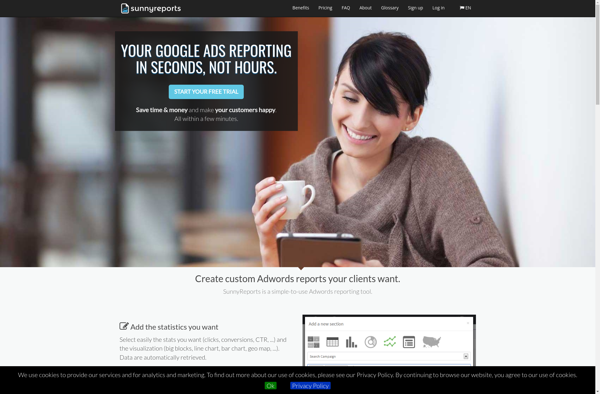
Sunnyreports is an open-source business intelligence and reporting solution designed to help companies gain better insights from their data. Here are some key capabilities of Sunnyreports:Intuitive drag-and-drop interface to build interactive reports and dashboards without codingConnectors to integrate data from SQL, NoSQL databases, cloud apps like Google Analytics, etc.Diverse visualization...
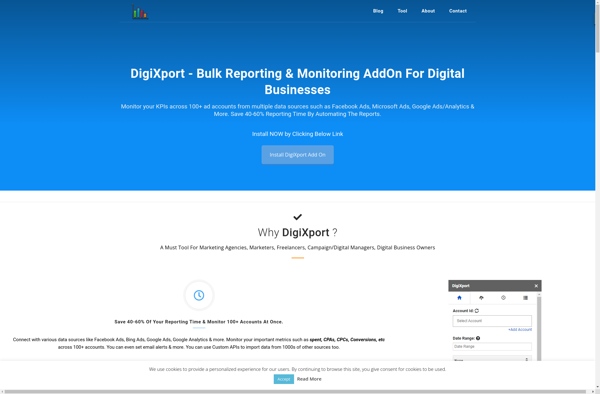
DigiXport is a robust digital asset management (DAM) platform designed for organizing, managing, and distributing digital media assets like images, videos, audio, documents, and more. It serves as a centralized media library with powerful search, automation, and collaboration tools to help teams streamline workflows.Key features of DigiXport include:Intelligent auto-tagging and...