Sunnyreports is an open-source business intelligence and reporting tool. It allows users to connect to various data sources, visualize data through charts/graphs, and create dynamic reports. Key features include drag-and-drop report builder, scheduling and exporting reports, and
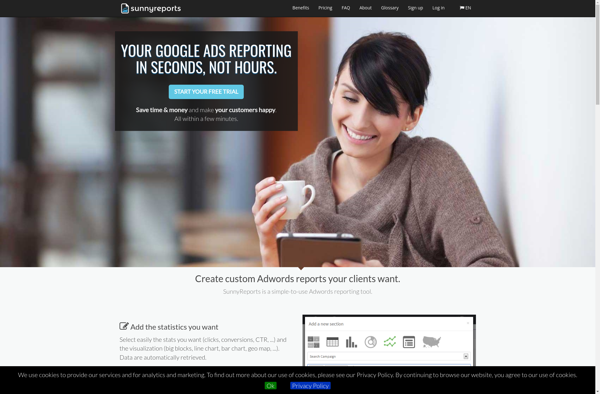
Sunnyreports: Open-Source Business Intelligence & Reporting Tool
Sunnyreports is an open-source business intelligence and reporting tool. It allows users to connect to various data sources, visualize data through charts/graphs, and create dynamic reports. Key features include drag-and-drop report builder, scheduling and exporting reports, and access control for sharing reports.
What is Sunnyreports?
Sunnyreports is an open-source business intelligence and reporting solution designed to help companies gain better insights from their data. Here are some key capabilities of Sunnyreports:
Intuitive drag-and-drop interface to build interactive reports and dashboards without coding
Connectors to integrate data from SQL, NoSQL databases, cloud apps like Google Analytics, etc.
Diverse visualization options including charts, tables, gauges, maps, and more
Dynamic report formatting with parameters, filters, and conditional formatting
Scheduled report distribution through emails, portals and file exports
Role-based access control to securely share reports and insights
On-premise or cloud deployment with enterprise-grade scalability and security
With its user-friendly interface, robust feature set and open-source model, Sunnyreports enables organizations to democratize business analytics & reporting across teams in a cost-effective manner.
Sunnyreports Features
Features
Drag-and-drop report builder
Connect to various data sources like SQL, NoSQL, REST APIs
Interactive data visualization with charts and graphs
Dynamic report creation
Report scheduling and exporting
Access control for sharing reports
Pricing
Open Source
Pros
Free and open source
Easy to use drag-and-drop interface
Support for multiple data sources
Interactive data visualizations
Can schedule and export reports
Cons
Limited built-in chart types
Less customizable than some commercial BI tools
Not ideal for large complex datasets
Lacks some advanced BI features like predictive modeling
Whatagraph is a robust yet easy-to-use data visualization and reporting platform suitable for business users of all backgrounds. With an intuitive drag-and-drop interface, anyone can create interactive dashboards, charts, maps, and graphs that automatically update when data changes.Whatagraph connects directly to data sources like MySQL, PostgreSQL, Excel, Google Sheets, and...
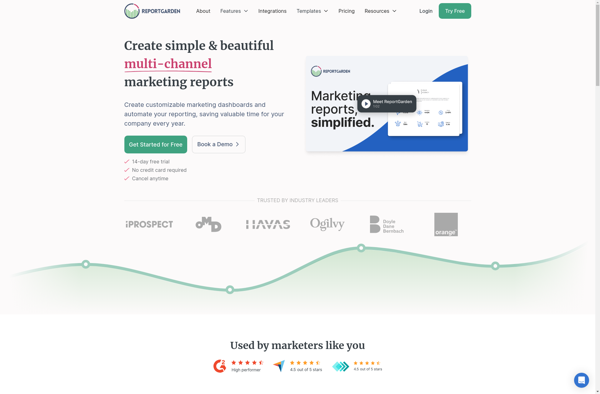
Reportgarden is a business intelligence and data visualization platform designed to help companies make data-driven decisions. It allows users to connect and combine data from multiple sources, including databases, cloud apps, and Excel files, into one centralized location.Some key features of Reportgarden include:Interactive dashboards - Build customizable dashboards with drag-and-drop...
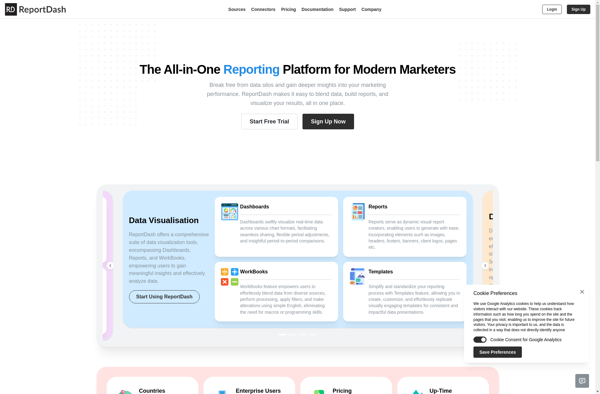
ReportDash is a versatile business intelligence and analytics platform suitable for companies of all sizes. It allows users to connect to various data sources, clean and transform data, and create interactive reports and dashboards that provide actionable insights.Key features include:Intuitive drag-and-drop interface to build reports and dashboards quicklyVariety of customizable...
Muralio is a leading digital workspace for visual collaboration in agile teams. It provides an infinite, cloud-based digital canvas that facilitates remote design thinking sessions, workshops, brainstorms, and ideation for distributed teams across the enterprise.Key features include:Virtual sticky notes, drawings, diagrams, frames for storyboardingTemplates for agile ceremonies like retrospectives, design...
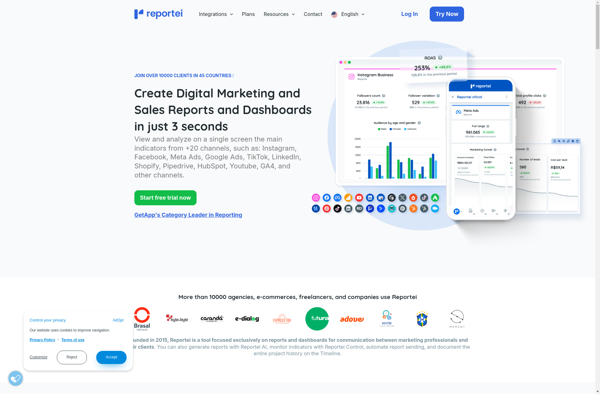
Reportei is an open-source business intelligence and analytics platform used to visualize, analyze and share data through interactive dashboards, reports and graphs. It provides an intuitive drag-and-drop interface that allows non-technical users to easily create rich, interactive reports and dashboards.Some key features of Reportei include:Interactive dashboards with advanced visualizations like...