Muralio is a cloud-based software for designing and facilitating collaborative workshops and design thinking sessions. It's a virtual workspace that allows distributed teams to visualize ideas, brainstorm, and create engaging visual content together in real-time.
Muralio is a cloud-based software for designing and facilitating collaborative workshops and design thinking sessions. It's a virtual workspace that allows distributed teams to visualize ideas, brainstorm, and create engaging visual content together in real-time.
What is Muralio?
Muralio is a leading digital workspace for visual collaboration in agile teams. It provides an infinite, cloud-based digital canvas that facilitates remote design thinking sessions, workshops, brainstorms, and ideation for distributed teams across the enterprise.
Key features include:
Virtual sticky notes, drawings, diagrams, frames for storyboarding
Templates for agile ceremonies like retrospectives, design sprints, journey mapping
Built-in integrations with top tools like Figma, Jira, Slack, etc
Real-time co-creation allows globally distributed teams to collaborate visually
Facilitator features to guide sessions and synthesis collective intelligence
Secure and scalable enterprise-grade offering
Used by innovative teams at leading companies like IBM, Autodesk, Atlassian, etc
With an intuitive, flexible platform to think and collaborate visually in real-time, teams can innovate products, services, customer experiences faster and enable organization-wide agility at scale.
Google Analytics is a free web analytics service offered by Google that tracks and reports website traffic. It is the most widely used web analytics service on the Internet.Some key features of Google Analytics include:Tracking number of visitors, page views, bounce rate, session duration, demographics, location, behavior and moreIn-depth analysis...
Clicky is a user-friendly web analytics platform designed to help website owners understand how visitors interact with their sites. It provides real-time analytics, allowing users to see visitor activity as it happens instead of waiting for delayed reports.Some key features of Clicky include:Real-time visitor tracking - See every pageview as...
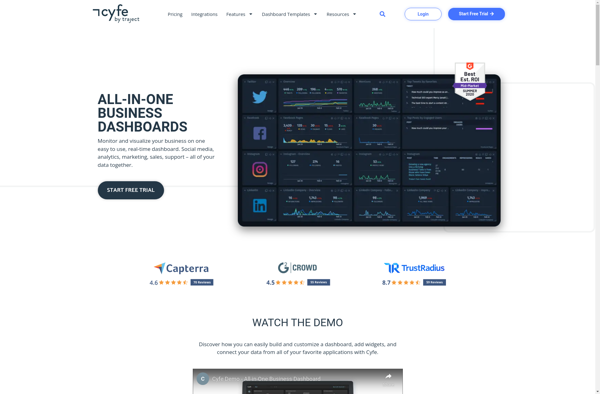
Cyfe is a powerful yet easy-to-use business dashboard and data visualization platform designed to help companies track, analyze, and visualize key performance indicators from all areas of their business. As an all-in-one solution, Cyfe eliminates the need to login to multiple accounts by integrating directly with popular business apps and...
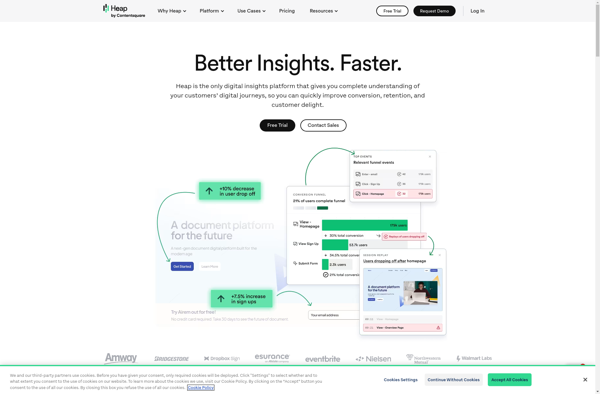
Heap Analytics is a robust user behavior analytics platform designed to help product and growth teams deeply understand how users interact with their digital products. It automatically captures every user action in your web or mobile application, allowing you to measure key metrics like funnels, retention cohorts, sticky features, and...
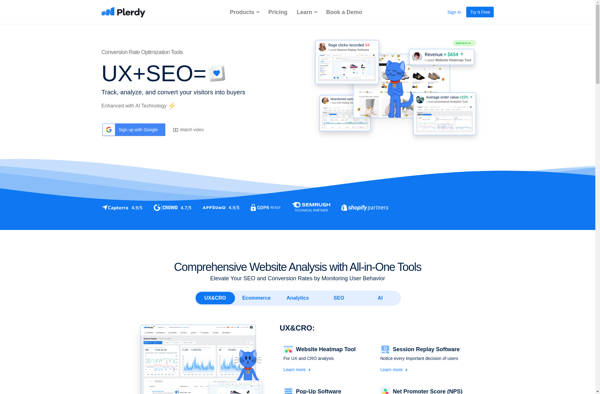
Plerdy is a user experience analytics platform designed to help website owners and marketers understand how visitors interact with their site. It provides valuable insights to optimize site performance and conversion rates.Key features of Plerdy include:Page-level analytics - Track page views, bounce rates, exit rates for each pageHeatmaps - See...
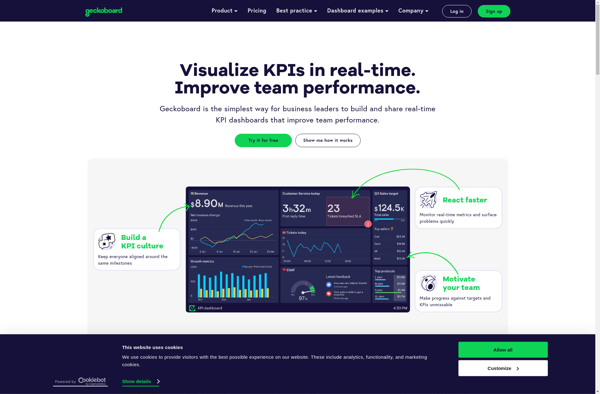
Geckoboard is a cloud-based business intelligence and data visualization platform used by over 30,000 companies worldwide. It allows users to build interactive TV dashboards that bring together data from various sources, both within a company and from external applications, to provide real-time visibility into critical metrics.Geckoboard integrates with 100+ data...
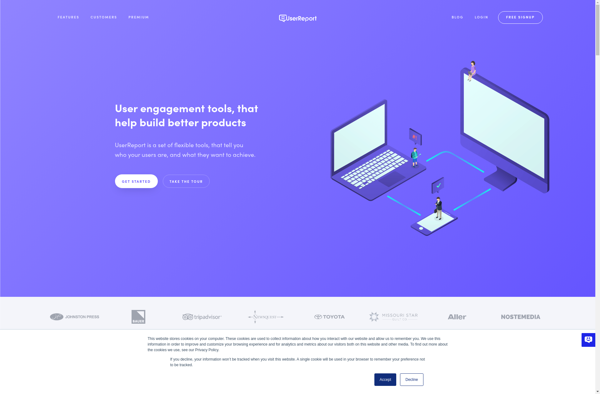
UserReport is a comprehensive user research and feedback software designed to help product teams capture and analyze qualitative and quantitative data from users. Here are some key features of UserReport:Surveys - Create targeted surveys to gain feedback from users. Get feedback on specific features, measure satisfaction through CSAT/NPS surveys, and...
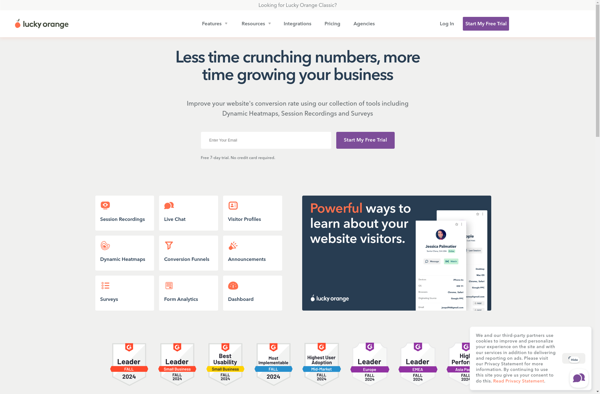
Lucky Orange is a user-friendly web analytics software designed to help understand and optimize the customer experience on your website. Some key features include:Session recordings - Watch Visitor recordings to see exactly how visitors use your site. Understand behavior to optimize conversions.Heatmaps - See where visitors click, scroll, and pay...
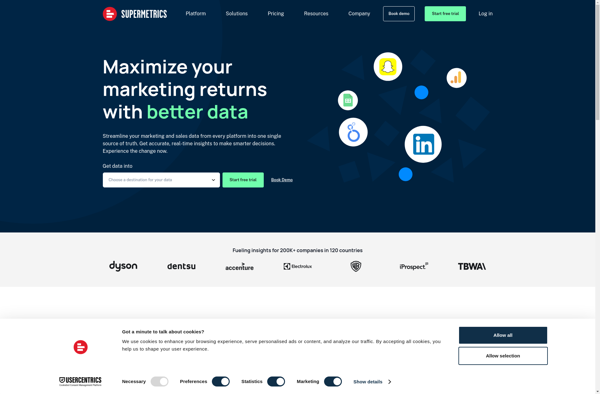
Supermetrics is a powerful marketing analytics software that allows users to connect, analyze and visualize data from a wide variety of sources. It serves as a centralized platform to manage all your marketing data in one place.With Supermetrics, you can connect data sources such as:Google AnalyticsFacebook AdsAdWordsYouTubeLinkedInTwitterMicrosoft AdvertisingSalesforceStripeAnd many moreSome...
Whatagraph is a robust yet easy-to-use data visualization and reporting platform suitable for business users of all backgrounds. With an intuitive drag-and-drop interface, anyone can create interactive dashboards, charts, maps, and graphs that automatically update when data changes.Whatagraph connects directly to data sources like MySQL, PostgreSQL, Excel, Google Sheets, and...
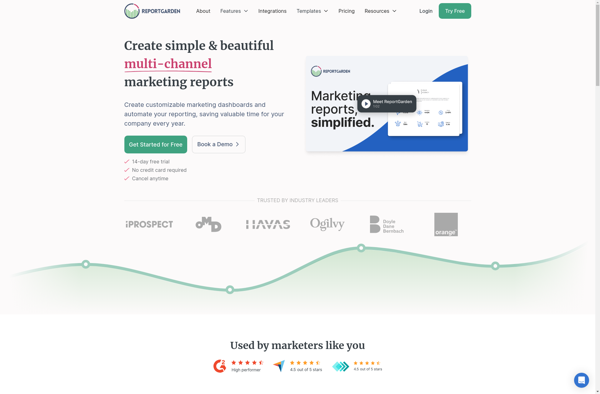
Reportgarden is a business intelligence and data visualization platform designed to help companies make data-driven decisions. It allows users to connect and combine data from multiple sources, including databases, cloud apps, and Excel files, into one centralized location.Some key features of Reportgarden include:Interactive dashboards - Build customizable dashboards with drag-and-drop...
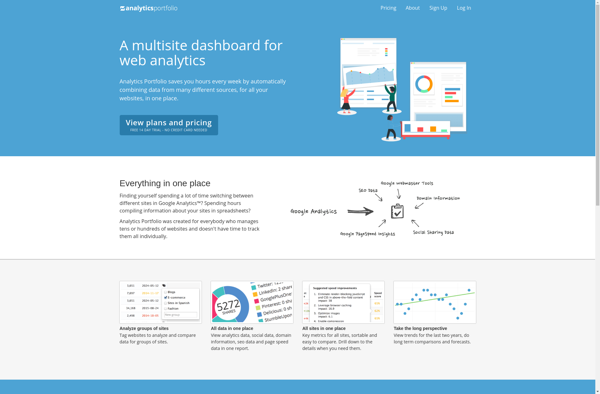
Analytics Portfolio is a flexible business intelligence and analytics solution designed to help companies of all sizes gain deeper insights from their data. Some key features and benefits of Analytics Portfolio include:Interactive dashboards and reports - Users can create customized dashboards with drag-and-drop simplicity to visualize key metrics and KPIs....
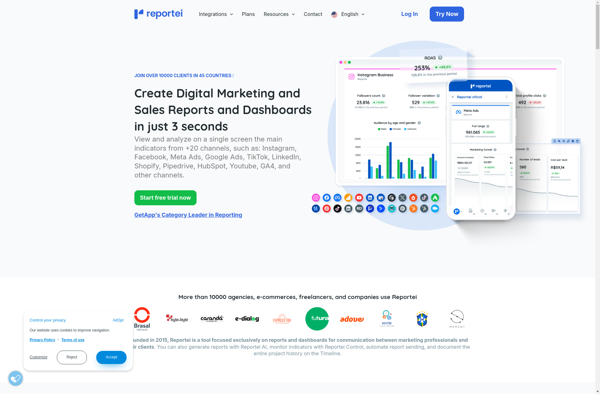
Reportei is an open-source business intelligence and analytics platform used to visualize, analyze and share data through interactive dashboards, reports and graphs. It provides an intuitive drag-and-drop interface that allows non-technical users to easily create rich, interactive reports and dashboards.Some key features of Reportei include:Interactive dashboards with advanced visualizations like...
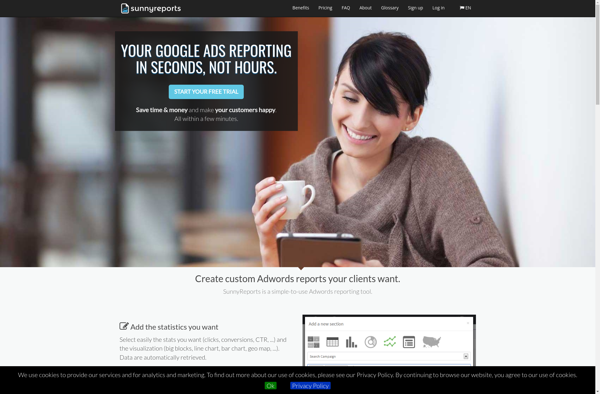
Sunnyreports is an open-source business intelligence and reporting solution designed to help companies gain better insights from their data. Here are some key capabilities of Sunnyreports:Intuitive drag-and-drop interface to build interactive reports and dashboards without codingConnectors to integrate data from SQL, NoSQL databases, cloud apps like Google Analytics, etc.Diverse visualization...