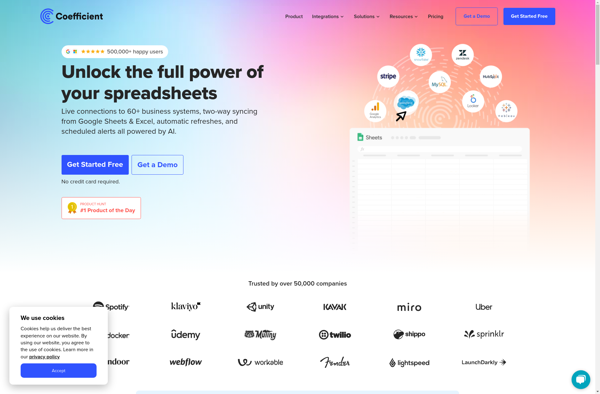
Supermetrics is a marketing analytics tool that helps users connect their data from different sources like Google Analytics, Facebook Ads, and more. It allows for easy reporting, visualization and analysis across multiple platforms.
Connect your data from various sources like Google Analytics, Facebook Ads, and more with Supermetrics, a powerful marketing analytics tool for easy reporting, visualization, and analysis across multiple platforms.
What is Supermetrics?
Supermetrics is a powerful marketing analytics software that allows users to connect, analyze and visualize data from a wide variety of sources. It serves as a centralized platform to manage all your marketing data in one place.
With Supermetrics, you can connect data sources such as:
Google Analytics
Facebook Ads
AdWords
YouTube
LinkedIn
Twitter
Microsoft Advertising
Salesforce
Stripe
And many more
Some key features include:
Automated report building - Schedule reports to be delivered via email or Slack.
Custom dashboards - Build visual dashboards to track all your important KPIs.
Data warehouse - Store unlimited amounts of data for deeper analysis.
300+ app integrations - Connect all your marketing tools.
Intuitive interface - user-friendly way to manage marketing data.
With its extensive integrations and automated reporting capabilities, Supermetrics saves time and simplifies data analysis for marketers. It's a powerful but easy-to-use platform for marketing analytics and reporting.
Supermetrics Features
Features
Connects data from multiple platforms like Google Analytics, Facebook Ads, Google Ads, etc
Automates data collection and transformation
Provides pre-built templates and integrations for easy reporting and analysis
Offers data visualization tools like dashboards and charts
Allows users to create custom reports
Has options for scheduled report delivery
Pricing
Freemium
Subscription-Based
Pros
Saves time by automating data collection and reporting
Easy to connect data from multiple sources
User-friendly interface
Good customer support
Large library of pre-built templates and integrations
Google Analytics is a free web analytics service offered by Google that tracks and reports website traffic. It is the most widely used web analytics service on the Internet.Some key features of Google Analytics include:Tracking number of visitors, page views, bounce rate, session duration, demographics, location, behavior and moreIn-depth analysis...
Crystal Reports is a flexible business reporting tool used to design and generate professional reports from virtually any data source. Originally created by Crystal Services and now owned by SAP, Crystal Reports has been around since the early 1990s and has become one of the most popular reporting tools used...
Statify is a user-friendly web analytics platform designed to help website owners, bloggers, and small business owners better understand their website traffic and visitor behavior. Some key features of Statify include:Intuitive dashboards and reports providing actionable insights on website visitors, traffic sources, popular content, and more.Real-time analytics allowing you to...
WP Power Stats is a powerful WordPress plugin used by over 100,000 WordPress sites to track valuable site analytics and provide actionable insights. It captures detailed statistics about your WordPress site's content, traffic sources, and audience engagement.Some of the key metrics tracked by WP Power Stats include:Post and page viewsMost...
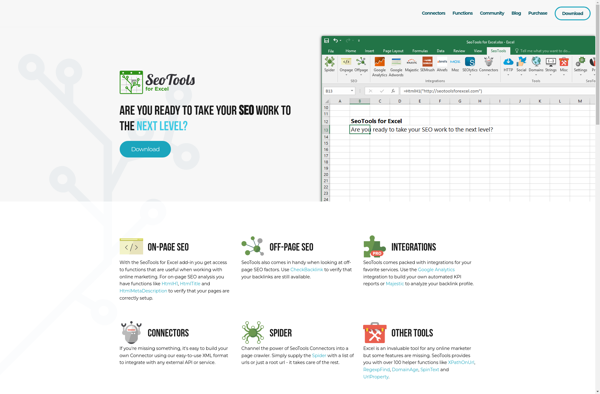
SeoTools for Excel is an add-in for Microsoft Excel that brings powerful SEO tools directly into the Excel interface. It eliminates the need to switch between different software tools to do SEO research and analysis.With SeoTools for Excel, you can track rankings for target keywords right in Excel, analyze the...
Blockspring is a cloud-based software platform that enables developers to integrate advanced Excel functionality into their web and mobile applications. It provides a library of hundreds of Excel formulas, scripts, and spreadsheet capabilities that can be called via API.Some key features of Blockspring include:Add Excel calculations, logic, and data transformations...
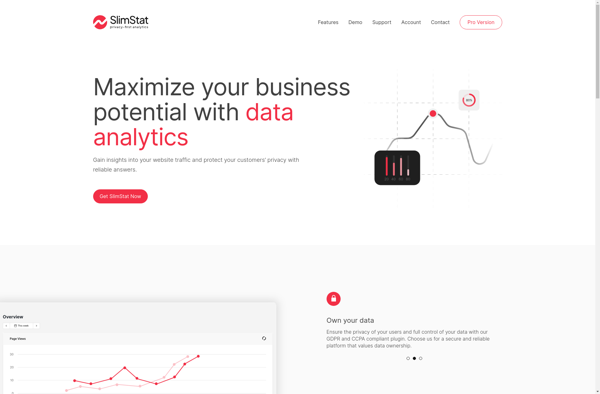
Slimstat Analytics is a lightweight open-source web analytics software designed to provide website owners and bloggers with insights into their visitor traffic and behavior patterns. Some key features of Slimstat Analytics include:Lightweight code with minimal impact on website performanceTracks detailed raw data like IP addresses, geographic locations, browser types, referer...
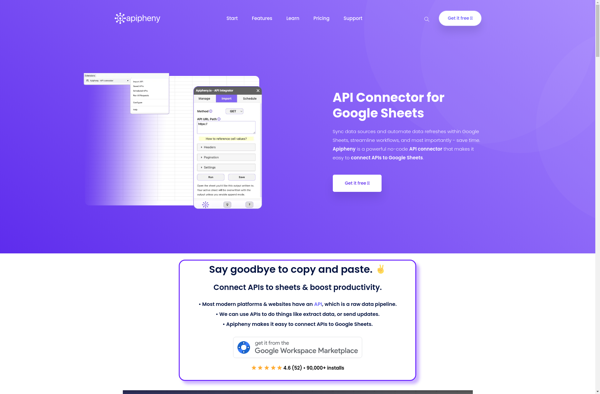
Apipheny is an end-to-end API management platform designed to help teams build, manage, and analyze APIs more efficiently. Some key features of Apipheny include:Visual API Designer: Allows you to design APIs visually by dragging and dropping components instead of coding.Mocking: Auto-generates mock servers and mocked API responses for faster testing.Documentation:...
Coefficient is a cloud-based virtual office platform designed for remote and distributed teams. It combines popular workplace tools like video conferencing, chat, calendars, documents, and task management into one unified easy-to-use workspace.Key features of Coefficient include:HD video meetings - Face-to-face interactions with screen sharing, reactions, and virtual backgroundsTeam chat -...
Whatagraph is a robust yet easy-to-use data visualization and reporting platform suitable for business users of all backgrounds. With an intuitive drag-and-drop interface, anyone can create interactive dashboards, charts, maps, and graphs that automatically update when data changes.Whatagraph connects directly to data sources like MySQL, PostgreSQL, Excel, Google Sheets, and...
Coupler.io is a cloud-based data integration and ETL (extract, transform, load) platform designed to help users integrate data from multiple sources. Some key features of Coupler.io include:Intuitive drag and drop interface to map data between sources and targets without writing codePre-built connectors to various data sources like databases, SaaS applications,...
API Connector is an integration middleware tool that enables applications to seamlessly connect with and leverage the capabilities of external APIs. It provides a centralized interface to manage API connections, handle authentication, transform data into the required format, map between the application's data model and the API, combine data from...
Reportgarden is a business intelligence and data visualization platform designed to help companies make data-driven decisions. It allows users to connect and combine data from multiple sources, including databases, cloud apps, and Excel files, into one centralized location.Some key features of Reportgarden include:Interactive dashboards - Build customizable dashboards with drag-and-drop...
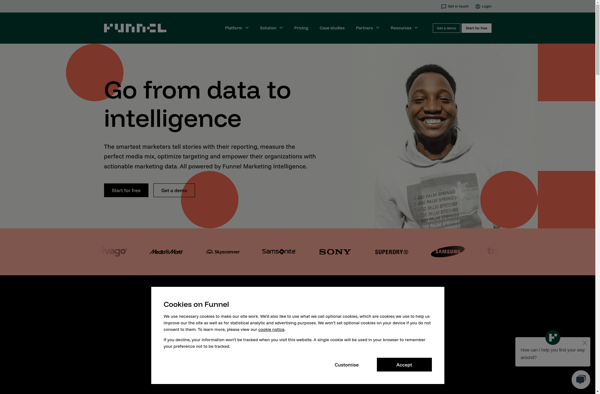
Funnel.io is a powerful yet easy-to-use funnel builder and marketing automation platform. It allows anyone to create beautiful, high-converting sales funnels, landing pages, forms, email sequences, and more without technical skills.With an intuitive drag-and-drop interface, Funnel.io makes it simple for marketers, agencies, and business owners to boost leads and sales....
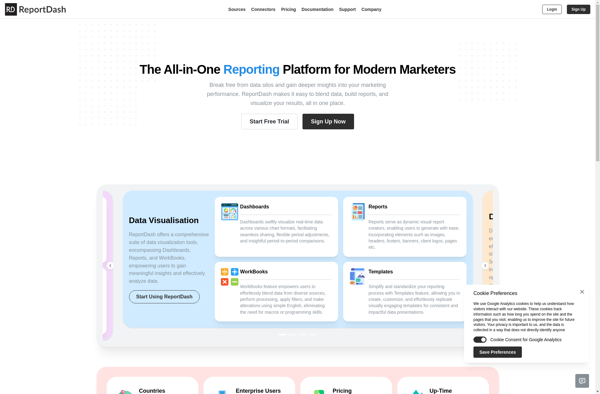
ReportDash is a versatile business intelligence and analytics platform suitable for companies of all sizes. It allows users to connect to various data sources, clean and transform data, and create interactive reports and dashboards that provide actionable insights.Key features include:Intuitive drag-and-drop interface to build reports and dashboards quicklyVariety of customizable...
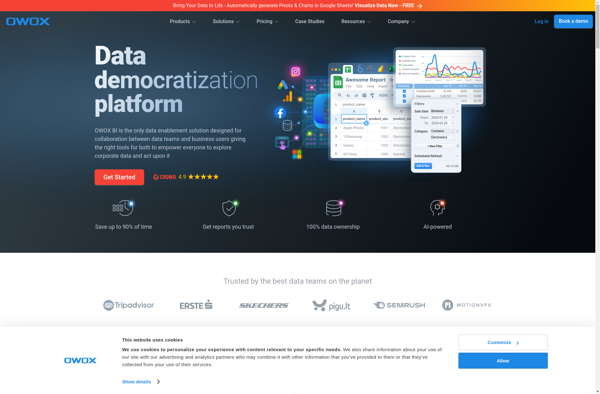
OWOX BI is a business intelligence and analytics platform specifically designed for marketing teams to improve campaign performance. It helps you collect, analyze and visualize data from different online sources like your website, ads, search engine marketing, social media and more.Key features of OWOX BI include:Data connectors to import website...
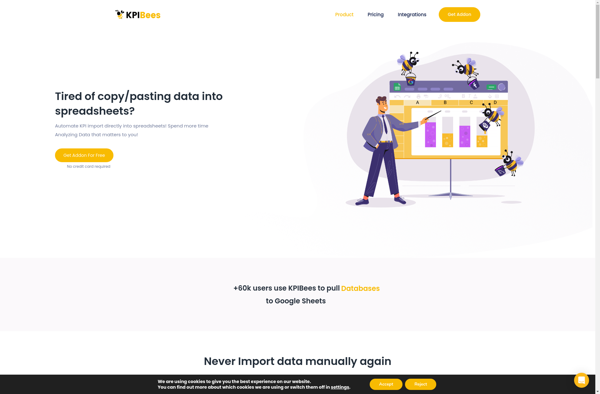
KPIBees is a flexible business intelligence and data visualization platform used by organizations to monitor key performance indicators (KPIs). It provides an easy way to connect various data sources, create customized dashboards with charts/graphs, and share actionable insights across teams.Some key features of KPIBees include:Intuitive drag-and-drop interface to build interactive...
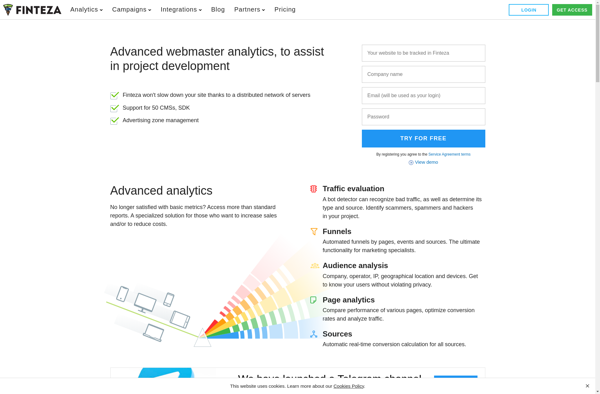
Finteza is a cloud-based financial management software designed specifically for small businesses and entrepreneurs. It consolidates key financial operations like invoicing, payments, expense tracking, financial reporting, and more onto a single intuitive platform.Key features of Finteza include:Invoicing - Create, customize and send professional invoices, accept online payments, and track payments.Expense...
JustControl.it is a comprehensive home automation platform designed to control and automate various devices and systems within a home. It works with most major smart home protocols including Z-Wave, ZigBee, WiFi, and Bluetooth to connect lights, locks, thermostats, sensors, shades, and other compatible devices.Through the JustControl.it mobile apps for iOS...
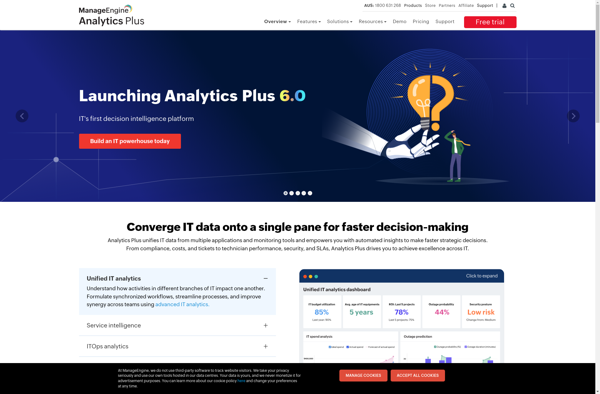
Analytics Plus is a business intelligence and data analytics software designed to help companies make data-driven decisions. It provides tools for data preparation, analysis, visualization, and reporting all in one integrated platform.With Analytics Plus, users can connect to various data sources such as SQL databases, cloud apps, and Excel files...
Muralio is a leading digital workspace for visual collaboration in agile teams. It provides an infinite, cloud-based digital canvas that facilitates remote design thinking sessions, workshops, brainstorms, and ideation for distributed teams across the enterprise.Key features include:Virtual sticky notes, drawings, diagrams, frames for storyboardingTemplates for agile ceremonies like retrospectives, design...
UserSignals is a product analytics software that provides insight into user behavior to help teams build better digital products. It offers features like:Session replays - Watch recordings of real user sessions to see how users interact with your product.Heatmaps - Visualize where users click, tap, scroll and focus attention on...
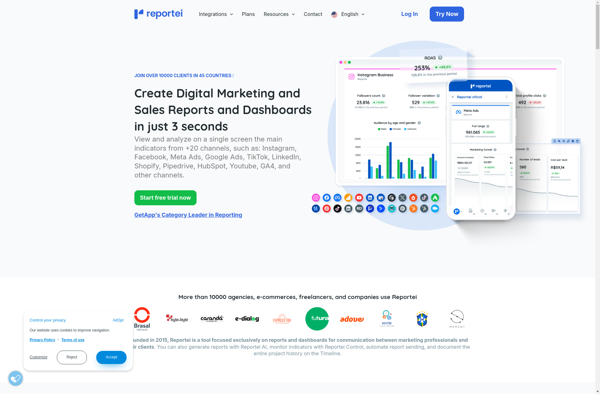
Reportei is an open-source business intelligence and analytics platform used to visualize, analyze and share data through interactive dashboards, reports and graphs. It provides an intuitive drag-and-drop interface that allows non-technical users to easily create rich, interactive reports and dashboards.Some key features of Reportei include:Interactive dashboards with advanced visualizations like...
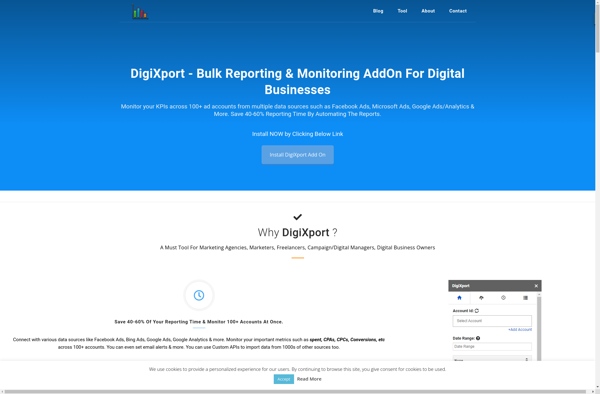
DigiXport is a robust digital asset management (DAM) platform designed for organizing, managing, and distributing digital media assets like images, videos, audio, documents, and more. It serves as a centralized media library with powerful search, automation, and collaboration tools to help teams streamline workflows.Key features of DigiXport include:Intelligent auto-tagging and...
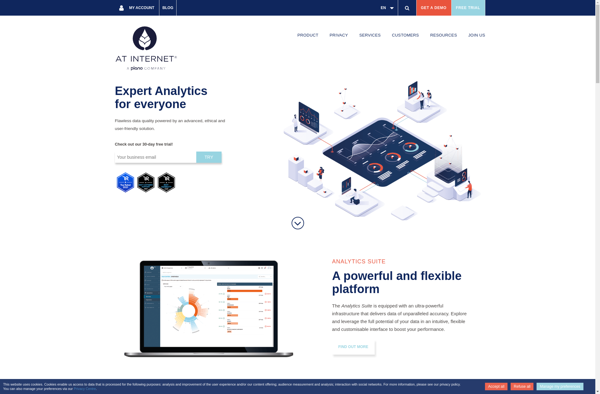
AT Internet is a feature-rich web analytics platform used by companies to track and analyze visits, traffic sources, and customer behavior on their websites and mobile apps. Some key capabilities and benefits of AT Internet include:User-friendly dashboard to monitor real-time visits, geo distribution of traffic, most popular pages and content,...