Analytics Plus

Analytics Plus

Analytics Plus is a business intelligence and analytics software that allows users to visualize, analyze, and share data insights. It has drag-and-drop dashboard building, automated reporting, and advanced analytics capabilities.
Analytics Plus image
data-visualization reporting dashboards analytics

Analytics Plus: Business Intelligence & Analytics Software

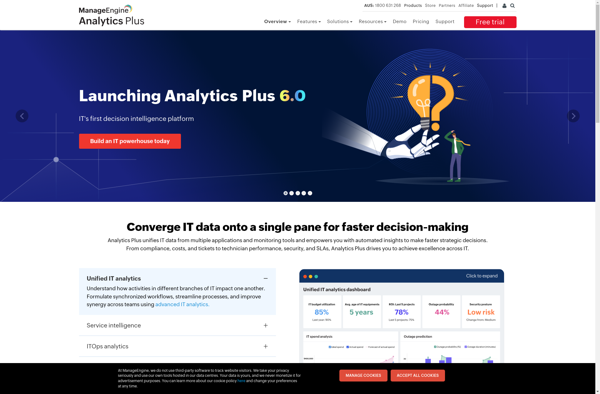
Visualize, analyze, and share data insights with Analytics Plus, a powerful business intelligence and analytics software featuring drag-and-drop dashboard building, automated reporting, and advanced analytics capabilities.

What is Analytics Plus?

Analytics Plus is a business intelligence and data analytics software designed to help companies make data-driven decisions. It provides tools for data preparation, analysis, visualization, and reporting all in one integrated platform.

With Analytics Plus, users can connect to various data sources such as SQL databases, cloud apps, and Excel files to import data. It has a user-friendly drag-and-drop interface for building interactive dashboards and data visualizations without coding. These dashboards allow for tracking KPIs, identifying trends and outliers, analyzing customer behavior, and more.

The software includes automated reporting features for scheduling and distributing reports to stakeholders. It also provides statistical analysis, predictive modeling, and data mining capabilities for advanced analytics. Users can collaborate by sharing dashboards, annotations, and analytics apps.

Some key capabilities and benefits of Analytics Plus include:

  • Interactive dashboards and reports
  • Drag-and-drop interface requiring no coding
  • Data connectivity to various sources and formats
  • Automated reporting for scheduled distribution
  • Collaboration tools for annotations and sharing
  • Statistical, predictive, and data mining analytics
  • Role-based permissions and access controls

With its robust analytics functionalities presented in interactive visualizations, Analytics Plus is an enterprise-ready BI and analytics solution suitable for data-driven organizations.

Analytics Plus Features

Features

  1. Drag-and-drop dashboard building
  2. Automated reporting
  3. Advanced analytics capabilities
  4. Data visualization tools
  5. Data analysis and insights

Pricing

  • Subscription-Based

Pros

Intuitive and user-friendly interface

Robust data analysis and visualization features

Automated reporting capabilities

Scalable for businesses of all sizes

Cons

Can be complex for beginners

Pricing may be expensive for small businesses

Limited customization options for dashboards


The Best Analytics Plus Alternatives

Top Business & Commerce and Business Intelligence & Analytics and other similar apps like Analytics Plus


Google Analytics icon

Google Analytics

Google Analytics is a free web analytics service offered by Google that tracks and reports website traffic. It is the most widely used web analytics service on the Internet.Some key features of Google Analytics include:Tracking number of visitors, page views, bounce rate, session duration, demographics, location, behavior and moreIn-depth analysis...
Google Analytics image
Clicky icon

Clicky

Clicky is a user-friendly web analytics platform designed to help website owners understand how visitors interact with their sites. It provides real-time analytics, allowing users to see visitor activity as it happens instead of waiting for delayed reports.Some key features of Clicky include:Real-time visitor tracking - See every pageview as...
Clicky image
Statcounter icon

Statcounter

Statcounter is a popular website analytics service used by over 2 million websites. It allows website owners to track various metrics about visitors to their site in order to better understand their audience and improve the site.Some of the key features of Statcounter include:Visitor stats - number of visitors, new...
Statcounter image
AWStats icon

AWStats

AWStats is a powerful, free and open source log file analyzer for web analytics. It processes log files generated by web, FTP, mail and media servers, and produces customizable reports on website traffic statistics.Some key features of AWStats include:Generates reports on visits, unique visitors, page views, top pages, entry/exit pages,...
AWStats image
Matomo icon

Matomo

Matomo (formerly Piwik) is a leading open-source web analytics platform focused on privacy. It gives users valuable insights into their website, app, etc. traffic and engagement, while letting them retain full ownership and control of their analytics data.As an on-premises solution, Matomo provides an alternative to sending data to third-party...
Matomo image
Shynet icon

Shynet

Shynet is an open-source, decentralized network that serves as an alternative to the traditional internet. It allows users to access websites, applications, and services without going through centralized servers that can monitor traffic or censor content.Instead, Shynet operates on a peer-to-peer model where user devices connect directly to each other...
Shynet image
Supermetrics icon

Supermetrics

Supermetrics is a powerful marketing analytics software that allows users to connect, analyze and visualize data from a wide variety of sources. It serves as a centralized platform to manage all your marketing data in one place.With Supermetrics, you can connect data sources such as:Google AnalyticsFacebook AdsAdWordsYouTubeLinkedInTwitterMicrosoft AdvertisingSalesforceStripeAnd many moreSome...
Supermetrics image
Keitaro Tracker icon

Keitaro Tracker

Keitaro Tracker is an open source help desk and ticket support system software designed to help companies deliver excellent customer service and provide internal IT support. It comes with a wide range of features to manage the complete ticket lifecycle including:Ticketing system to log, categorize, prioritize and assign support ticketsSLA...
Keitaro Tracker image
Ninja Reports icon

Ninja Reports

Ninja Reports is a business intelligence and reporting software designed to help companies visualize and analyze data through interactive reports and dashboards. Some key features of Ninja Reports include:Drag-and-drop interface to easily build reports and dashboards without codingConnect to multiple data sources such as SQL, MySQL, Postgres, Salesforce, and moreLibrary...
Ninja Reports image
Open Web Analytics icon

Open Web Analytics

Open Web Analytics (OWA) is an open source web analytics platform that you can use to track and analyze traffic on your websites. It provides a wealth of data to help you understand your visitors and make better decisions about your online marketing and content strategy.Some key features of OWA...
Open Web Analytics image
Zolmetric Analytics icon

Zolmetric Analytics

Zolmetric Analytics is a comprehensive business intelligence and data analytics solution designed to help companies make data-driven decisions. It provides powerful tools for data visualization, reporting, predictive modeling, forecasting, and more.With interactive dashboards and custom reports, Zolmetric makes it easy for business users to analyze data and share insights without...