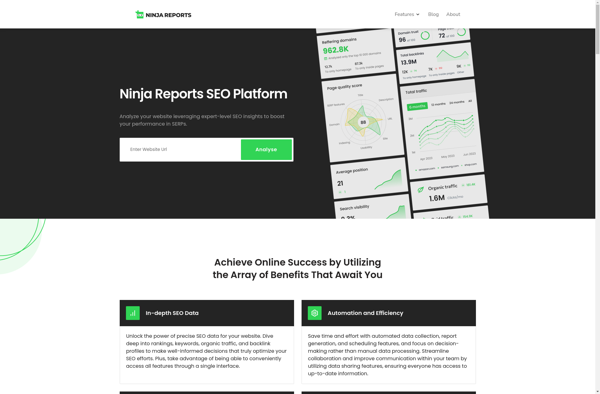
Ninja Reports is a business intelligence and reporting platform that allows users to easily create interactive reports and dashboards from multiple data sources. It has drag-and-drop functionality, customizable templates, scheduling and sharing capabilities.
Ninja Reports: Business Intelligence and Reporting Platform
Ninja Reports is a business intelligence and reporting platform that allows users to easily create interactive reports and dashboards from multiple data sources. It has drag-and-drop functionality, customizable templates, scheduling and sharing capabilities.
What is Ninja Reports?
Ninja Reports is a business intelligence and reporting software designed to help companies visualize and analyze data through interactive reports and dashboards. Some key features of Ninja Reports include:
Drag-and-drop interface to easily build reports and dashboards without coding
Connect to multiple data sources such as SQL, MySQL, Postgres, Salesforce, and more
Library of customizable report templates for common reporting needs
Interactive visualization options like charts, graphs, maps, and pivot tables
Robust filtering, sorting and grouping capabilities
Scheduled report delivery via email or portal access
Report bursting to export and share data
Scalable architecture to handle large data volumes
Role based permissions and data security
Mobile friendly responsive design
On-premise or cloud deployment options
Ninja Reports positions itself as an intuitive, self-service BI platform for teams and organizations looking for an alternative to traditional BI tools with a steep learning curve. Its drag-and-drop simplicity combined with enterprise-grade governance makes it easy for non-technical users to create and manage reports independently.
Ninja Reports Features
Features
Drag-and-drop report builder
Customizable templates
Ability to connect to multiple data sources
Interactive dashboards
Scheduling and sharing capabilities
Exporting reports to various formats
Pricing
Freemium
Subscription-Based
Pros
User-friendly interface
Wide range of data source integrations
Customizable reporting and visualization options
Collaborative features for sharing and scheduling reports
Responsive and mobile-friendly dashboards
Cons
Limited free plan features
Can be more expensive compared to some competitors
May require some technical expertise to set up complex reports
Limited advanced analytics and data modeling capabilities
Google Analytics is a free web analytics service offered by Google that tracks and reports website traffic. It is the most widely used web analytics service on the Internet.Some key features of Google Analytics include:Tracking number of visitors, page views, bounce rate, session duration, demographics, location, behavior and moreIn-depth analysis...
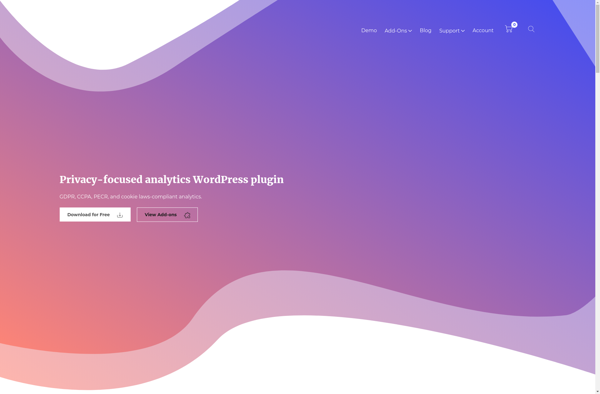
Clicky is a user-friendly web analytics platform designed to help website owners understand how visitors interact with their sites. It provides real-time analytics, allowing users to see visitor activity as it happens instead of waiting for delayed reports.Some key features of Clicky include:Real-time visitor tracking - See every pageview as...
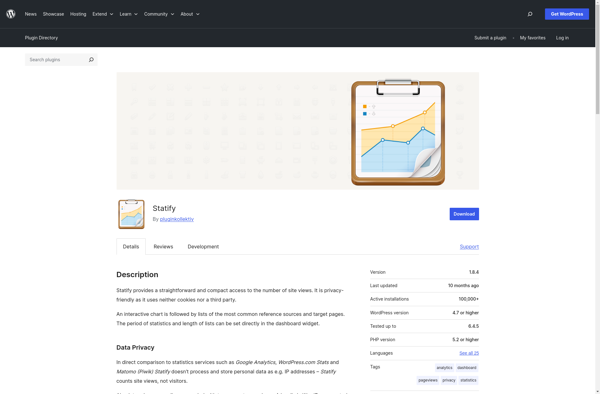
Statify is a user-friendly web analytics platform designed to help website owners, bloggers, and small business owners better understand their website traffic and visitor behavior. Some key features of Statify include:Intuitive dashboards and reports providing actionable insights on website visitors, traffic sources, popular content, and more.Real-time analytics allowing you to...
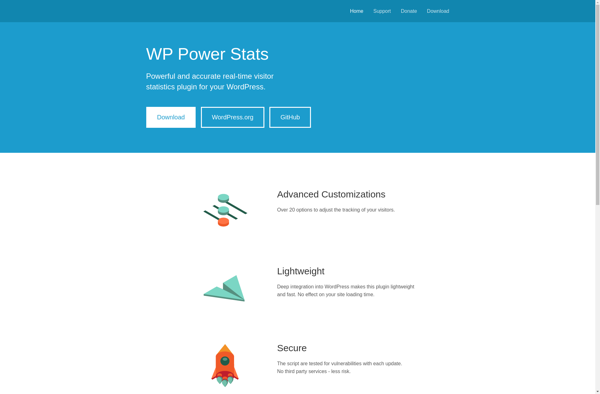
WP Power Stats is a powerful WordPress plugin used by over 100,000 WordPress sites to track valuable site analytics and provide actionable insights. It captures detailed statistics about your WordPress site's content, traffic sources, and audience engagement.Some of the key metrics tracked by WP Power Stats include:Post and page viewsMost...
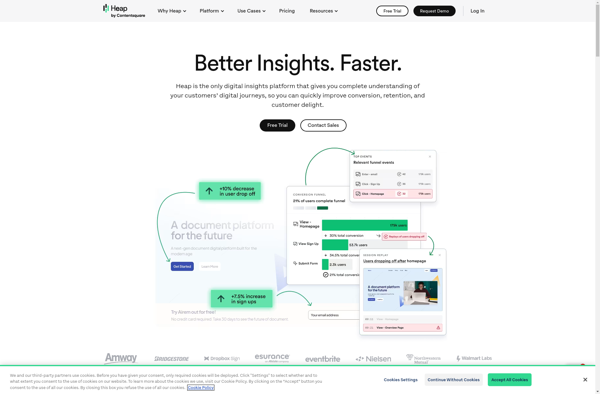
Heap Analytics is a robust user behavior analytics platform designed to help product and growth teams deeply understand how users interact with their digital products. It automatically captures every user action in your web or mobile application, allowing you to measure key metrics like funnels, retention cohorts, sticky features, and...
UserReport is a comprehensive user research and feedback software designed to help product teams capture and analyze qualitative and quantitative data from users. Here are some key features of UserReport:Surveys - Create targeted surveys to gain feedback from users. Get feedback on specific features, measure satisfaction through CSAT/NPS surveys, and...
Slimstat Analytics is a lightweight open-source web analytics software designed to provide website owners and bloggers with insights into their visitor traffic and behavior patterns. Some key features of Slimstat Analytics include:Lightweight code with minimal impact on website performanceTracks detailed raw data like IP addresses, geographic locations, browser types, referer...
Whatagraph is a robust yet easy-to-use data visualization and reporting platform suitable for business users of all backgrounds. With an intuitive drag-and-drop interface, anyone can create interactive dashboards, charts, maps, and graphs that automatically update when data changes.Whatagraph connects directly to data sources like MySQL, PostgreSQL, Excel, Google Sheets, and...
SERPStream is a user-friendly, cloud-based rank tracking and SEO analytics platform designed to help businesses monitor and improve their search engine visibility. Key features include:Accurate tracking of keyword rankings across Google, Bing, Yahoo and other search enginesCustomizable keyword tracking for monitoring both organic and paid search performanceAutomated rank change alerts...
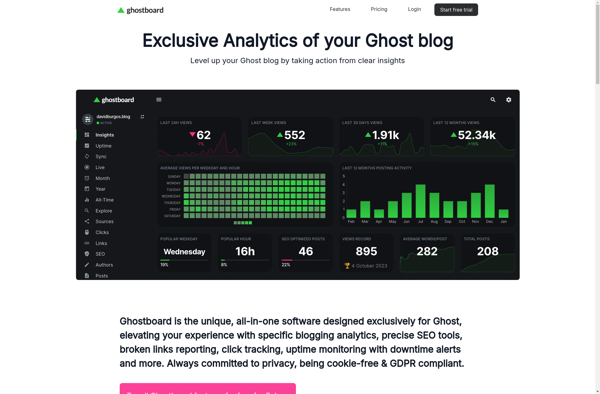
Ghostboard is an open-source web-based kanban project management application similar to Trello. It allows teams to organize their work in boards that contain lists of cards representing tasks or items. Some key features of Ghostboard include:Flexible boards, lists, and cards for organizing work any way you wantDrag-and-drop support to easily...
Uplifter is a conversion rate optimization and personalization platform designed specifically for ecommerce companies. It helps online stores increase revenue through features like A/B testing, multivariate testing, and AI-powered product recommendations.The platform provides an easy-to-use visual editor that allows marketers and store owners to create and deploy tests without needing...
RankTrackr is a comprehensive rank tracking and SEO analytics platform designed to help SEO professionals and digital marketing agencies monitor and improve the organic search performance of their websites. The software lets you track keyword rankings across major search engines including Google, Bing, and Yahoo and local engines like Google...
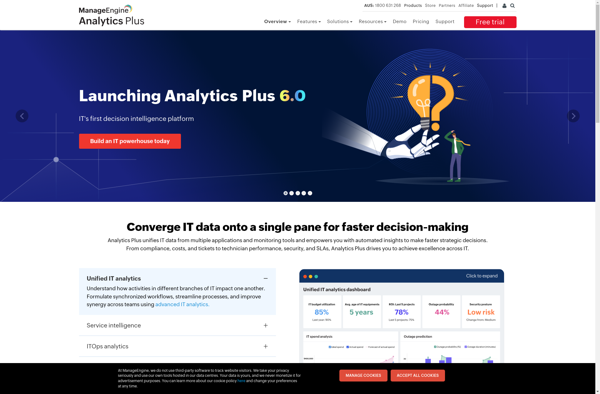
Analytics Plus is a business intelligence and data analytics software designed to help companies make data-driven decisions. It provides tools for data preparation, analysis, visualization, and reporting all in one integrated platform.With Analytics Plus, users can connect to various data sources such as SQL databases, cloud apps, and Excel files...
Canecto is an open-source software package for building online communities and social networks. It provides a range of features to help sites encourage user engagement and interaction.Some of the key features of Canecto include:User profiles - Members can create personal profile pages with photos, biographical info, interests etc.Forums - Category-based...
WP Statistics is a comprehensive WordPress analytics and statistics plugin used by over 3 million WordPress sites. It enables site owners to track vital traffic metrics and gain insights to improve their sites.With WP Statistics you can:View site visitor statistics like visits, visitors, pageviews, browser details, location details, and traffic...
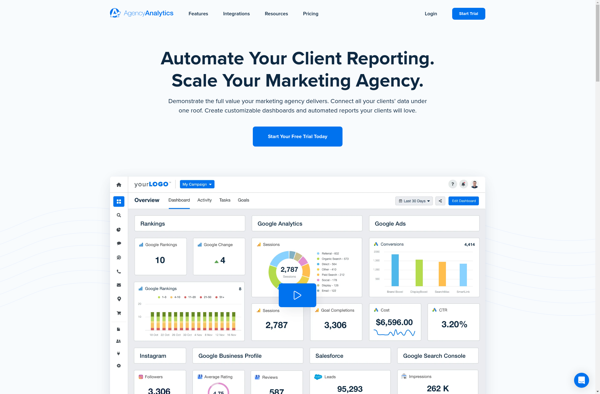
Agency Analytics is a business intelligence and data visualization software platform built specifically for advertising, digital, and media agencies. It consolidates data from disparate agency systems and advertising channels to provide insightful reporting and visualizations that help agencies demonstrate value, improve campaign performance, and make better business decisions.Key features of...