Agency Analytics is a business intelligence and data visualization platform designed specifically for marketing and advertising agencies. It integrates with various data sources to provide reporting and dashboards to analyze campaign performance, media costs, profitability, and o
Agency Analytics: Business Intelligence & Data Visualization Platform
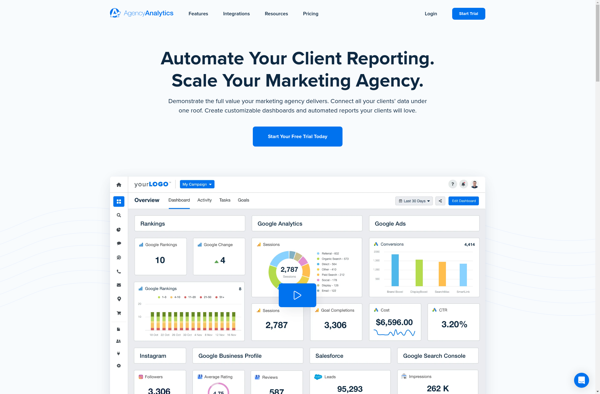
A marketing-focused analytics platform for agencies, providing reporting & dashboards on campaign performance, media costs & profitability
What is Agency Analytics?
Agency Analytics is a business intelligence and data visualization software platform built specifically for advertising, digital, and media agencies. It consolidates data from disparate agency systems and advertising channels to provide insightful reporting and visualizations that help agencies demonstrate value, improve campaign performance, and make better business decisions.
Key features of Agency Analytics include:
Customizable dashboards and reports to analyze campaign KPIs, media costs, profitability, resource allocation, and other agency data
Integration with media buying and planning tools, ad servers, website analytics, financial systems, and other data sources via APIs
Industry-specific metrics and dimensions tailored for advertising and media agencies
Robust attribution modeling and multi-touch analysis
Marketing mix modeling and budget optimization tools
Visualizations such as charts, graphs, and maps for data-driven presentations
Role-based permissions and white-label reporting
Agency Analytics provides agencies a centralized view of their data, helping them optimize spend across campaigns and clients, prove the value of their services, and improve media buying and campaign strategy over time through measurement and analytics.
Agency Analytics Features
Features
Data Integration
Reporting & Dashboards
Campaign Analysis
Media Cost Analysis
Profitability Analysis
Customizable Metrics
Pricing
Subscription-Based
Pros
Integrates data from multiple sources
Visualizations and dashboards to easily analyze data
Helps optimize campaign performance and media costs
Tracks profitability across clients, campaigns, etc
Cons
Can be complex to set up and learn
Limited flexibility compared to building custom dashboards
Requires time investment to integrate data sources and build reports
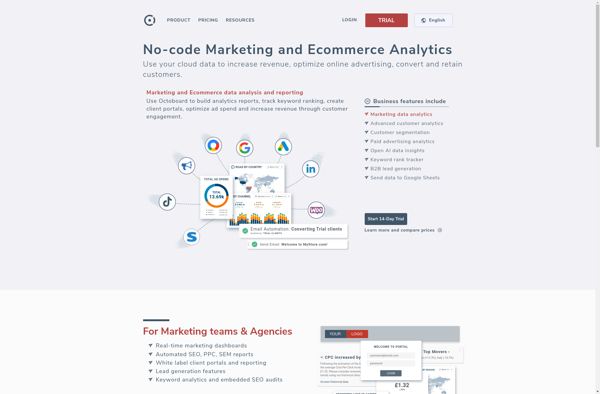
Octoboard is an open-source project management software designed for software development teams. It provides a Kanban-style project board for Agile project management and Scrum methodology. Key features of Octoboard include:Customizable Kanban boards to visualize work and map out software workflowsDeveloper-focused issue tracking with automatic linking to code commits and branchesTeam...
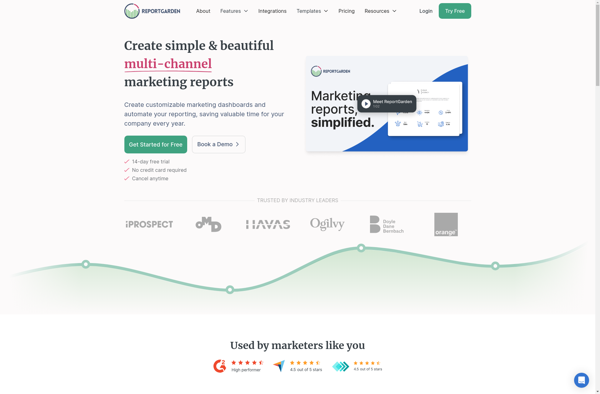
Reportgarden is a business intelligence and data visualization platform designed to help companies make data-driven decisions. It allows users to connect and combine data from multiple sources, including databases, cloud apps, and Excel files, into one centralized location.Some key features of Reportgarden include:Interactive dashboards - Build customizable dashboards with drag-and-drop...
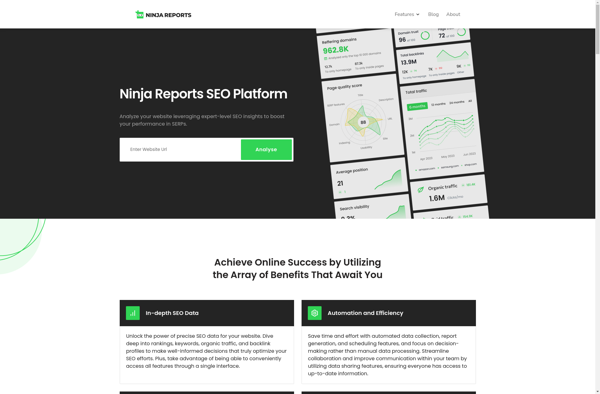
Ninja Reports is a business intelligence and reporting software designed to help companies visualize and analyze data through interactive reports and dashboards. Some key features of Ninja Reports include:Drag-and-drop interface to easily build reports and dashboards without codingConnect to multiple data sources such as SQL, MySQL, Postgres, Salesforce, and moreLibrary...
SerpWatch is a powerful competitive intelligence and search engine optimization platform used by digital marketers and SEO professionals. It enables users to track core keywords and monitor website rankings across major search engines including Google, Bing, and YouTube.Key features of SerpWatch include:Keyword ranking tracking - Track website rankings for target...
Reportei is an open-source business intelligence and analytics platform used to visualize, analyze and share data through interactive dashboards, reports and graphs. It provides an intuitive drag-and-drop interface that allows non-technical users to easily create rich, interactive reports and dashboards.Some key features of Reportei include:Interactive dashboards with advanced visualizations like...
Canecto is an open-source software package for building online communities and social networks. It provides a range of features to help sites encourage user engagement and interaction.Some of the key features of Canecto include:User profiles - Members can create personal profile pages with photos, biographical info, interests etc.Forums - Category-based...