Whatagraph is a data visualization and reporting software that allows users to create interactive data visualizations and reports. It has drag and drop functionality to easily create charts, graphs, and diagrams that automatically update when data changes.
Whatagraph: Interactive Data Visualization and Reporting Software
Whatagraph is a powerful software for creating interactive data visualizations and reports, with drag and drop functionality for easy chart creation.
What is Whatagraph?
Whatagraph is a robust yet easy-to-use data visualization and reporting platform suitable for business users of all backgrounds. With an intuitive drag-and-drop interface, anyone can create interactive dashboards, charts, maps, and graphs that automatically update when data changes.
Whatagraph connects directly to data sources like MySQL, PostgreSQL, Excel, Google Sheets, and more. It allows you to blend data from multiple sources into unified visualizations. You can track KPIs, create reports, analyze trends and share insights with stakeholders via auto-generated links.
Key features include:
Drag-and-drop interface to create interactive dashboards
Connect to multiple data sources like SQL, Excel, CSV, etc.
Blend data from different sources into unified charts
Track KPIs and create insightful reports
Analyze trends and detect anomalies
Share access via auto-generated links
Schedule and export visualizations
Template library of charts, dashboards and maps
Secured access and data encryption
With its easy-to-use workflow and powerful analytics capabilities, Whatagraph is a great choice for businesses looking to uncover insights, create reports and share data stories.
Whatagraph Features
Features
Drag-and-drop interface to create visualizations
Connects to various data sources like Google Analytics, Google Sheets, etc
Has prebuilt templates for common charts/graphs
Collaboration tools to share and edit visualizations
Can create dashboards from multiple visualizations
Google Analytics is a free web analytics service offered by Google that tracks and reports website traffic. It is the most widely used web analytics service on the Internet.Some key features of Google Analytics include:Tracking number of visitors, page views, bounce rate, session duration, demographics, location, behavior and moreIn-depth analysis...
Clicky is a user-friendly web analytics platform designed to help website owners understand how visitors interact with their sites. It provides real-time analytics, allowing users to see visitor activity as it happens instead of waiting for delayed reports.Some key features of Clicky include:Real-time visitor tracking - See every pageview as...
Microsoft Power BI is a powerful business analytics service developed by Microsoft. It empowers users to transform raw data into meaningful insights, create interactive reports and dashboards, and share data-driven stories within an organization. Power BI is designed to help businesses and individuals make informed decisions based on a comprehensive...
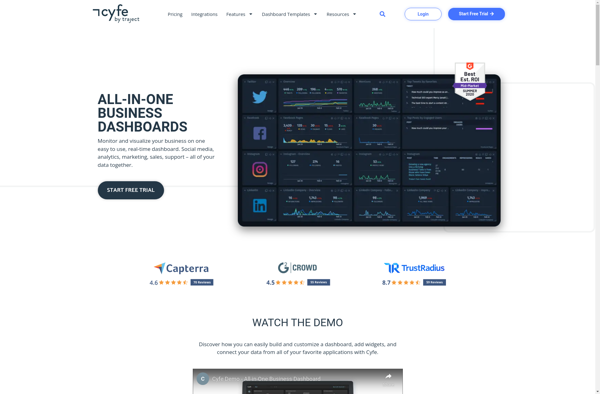
Cyfe is a powerful yet easy-to-use business dashboard and data visualization platform designed to help companies track, analyze, and visualize key performance indicators from all areas of their business. As an all-in-one solution, Cyfe eliminates the need to login to multiple accounts by integrating directly with popular business apps and...
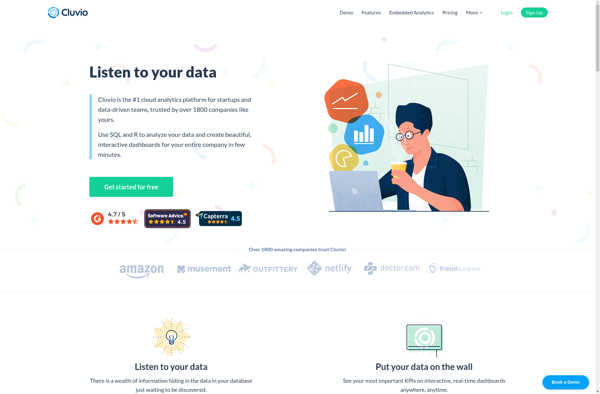
Cluvio is a business intelligence and analytics software designed for small and medium-sized businesses. It aims to make data analytics accessible to non-technical users through an intuitive graphical interface. Some key capabilities and benefits of Cluvio include:Interactive dashboards - Users can create customizable dashboards to visualize important business metrics and...
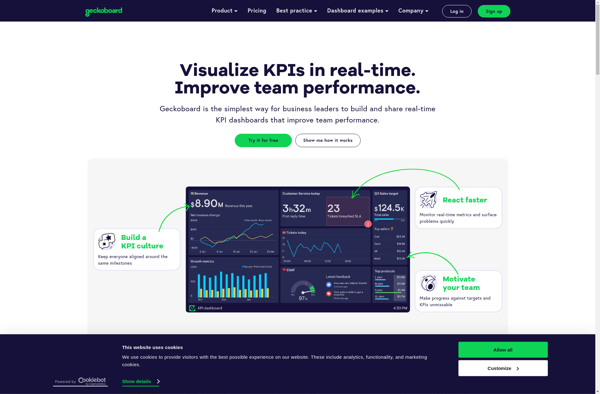
Geckoboard is a cloud-based business intelligence and data visualization platform used by over 30,000 companies worldwide. It allows users to build interactive TV dashboards that bring together data from various sources, both within a company and from external applications, to provide real-time visibility into critical metrics.Geckoboard integrates with 100+ data...
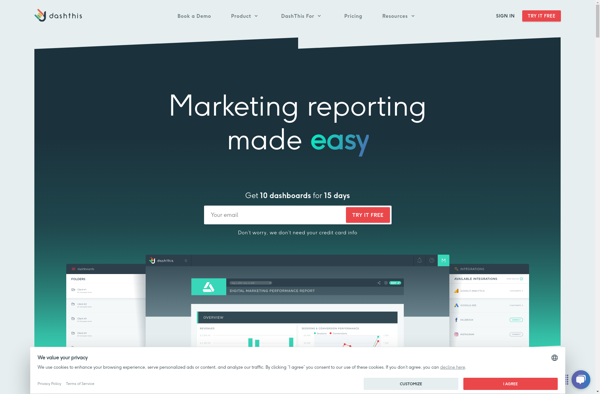
DashThis is a user-friendly project management and task tracking application designed for small teams and businesses. It provides an intuitive interface to plan projects, create tasks, set due dates, assign work to team members, track progress, and collaborate with others.Some key features of DashThis include:Flexible project views - See all...
WatchThemLive is a feature-rich live streaming and webcasting platform suitable for businesses, event organizers, teachers, and content creators looking to engage with their audience in real-time over the internet. Some key capabilities and benefits of WatchThemLive include:Multi-bitrate adaptive streaming for high quality broadcasts across devices and network conditionsInteractive features like...
Supermetrics is a powerful marketing analytics software that allows users to connect, analyze and visualize data from a wide variety of sources. It serves as a centralized platform to manage all your marketing data in one place.With Supermetrics, you can connect data sources such as:Google AnalyticsFacebook AdsAdWordsYouTubeLinkedInTwitterMicrosoft AdvertisingSalesforceStripeAnd many moreSome...
Reportgarden is a business intelligence and data visualization platform designed to help companies make data-driven decisions. It allows users to connect and combine data from multiple sources, including databases, cloud apps, and Excel files, into one centralized location.Some key features of Reportgarden include:Interactive dashboards - Build customizable dashboards with drag-and-drop...
Startegy is a comprehensive business strategy software designed to help organizations develop, execute, and manage their strategic plans effectively. It provides a centralized workspace for strategic planning and performance management.Key features of Startegy include:Objectives Management - Set organizational objectives, link them to overarching strategy, assign owners, and track progressStrategy Mapping...
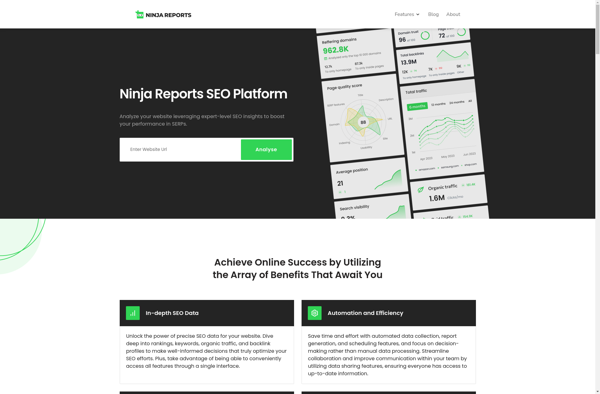
Ninja Reports is a business intelligence and reporting software designed to help companies visualize and analyze data through interactive reports and dashboards. Some key features of Ninja Reports include:Drag-and-drop interface to easily build reports and dashboards without codingConnect to multiple data sources such as SQL, MySQL, Postgres, Salesforce, and moreLibrary...
Everview is a visual collaboration software designed to simplify the design review and feedback process for teams. It provides a single online space to upload, discuss, and iterate on any visual content, including design files, documents, websites, presentations, and more.Some key features of Everview include:Real-time commenting and annotation tools for...
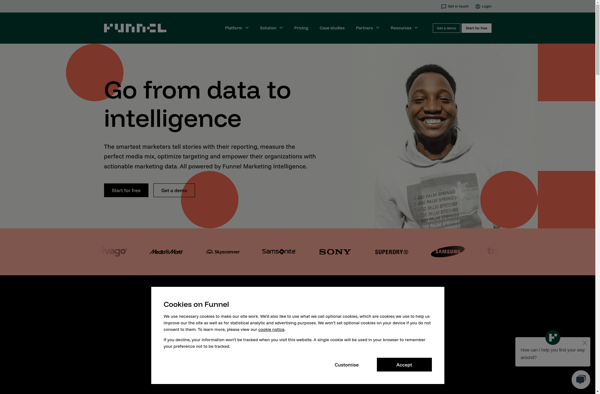
Funnel.io is a powerful yet easy-to-use funnel builder and marketing automation platform. It allows anyone to create beautiful, high-converting sales funnels, landing pages, forms, email sequences, and more without technical skills.With an intuitive drag-and-drop interface, Funnel.io makes it simple for marketers, agencies, and business owners to boost leads and sales....
Zenbu is a flexible and intuitive web-based database application that allows anyone to create custom databases to organize, track, and manage information. With an easy-to-use drag and drop interface, Zenbu makes it simple for non-technical users to set up relational databases, tables, forms, reports, charts and more without any coding...
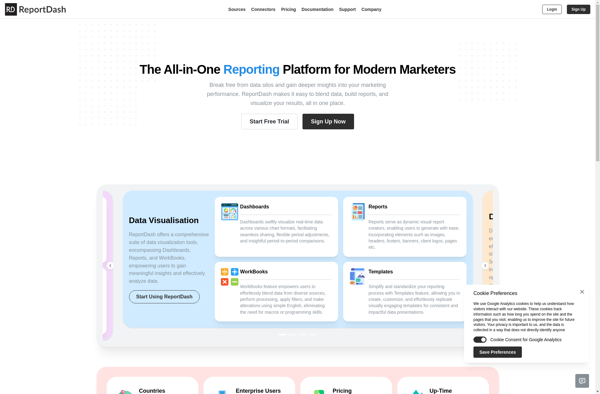
ReportDash is a versatile business intelligence and analytics platform suitable for companies of all sizes. It allows users to connect to various data sources, clean and transform data, and create interactive reports and dashboards that provide actionable insights.Key features include:Intuitive drag-and-drop interface to build reports and dashboards quicklyVariety of customizable...
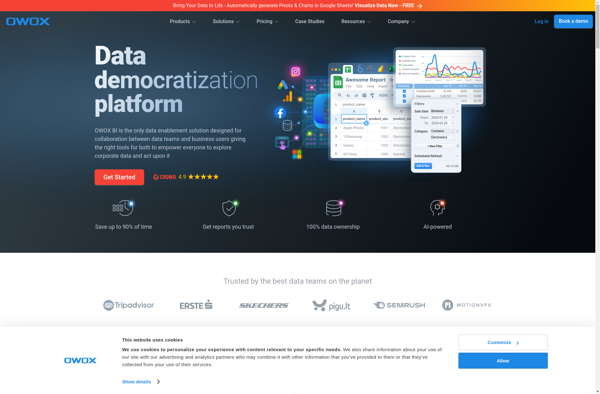
OWOX BI is a business intelligence and analytics platform specifically designed for marketing teams to improve campaign performance. It helps you collect, analyze and visualize data from different online sources like your website, ads, search engine marketing, social media and more.Key features of OWOX BI include:Data connectors to import website...
KPIBees is a flexible business intelligence and data visualization platform used by organizations to monitor key performance indicators (KPIs). It provides an easy way to connect various data sources, create customized dashboards with charts/graphs, and share actionable insights across teams.Some key features of KPIBees include:Intuitive drag-and-drop interface to build interactive...
Deep.BI is a flexible business intelligence and data visualization platform designed to help companies make data-driven decisions. It allows users to connect to a wide variety of data sources including databases, cloud apps, and files to import data.Once the data is imported, Deep.BI provides an easy drag-and-drop interface to build...
RankTrackr is a comprehensive rank tracking and SEO analytics platform designed to help SEO professionals and digital marketing agencies monitor and improve the organic search performance of their websites. The software lets you track keyword rankings across major search engines including Google, Bing, and Yahoo and local engines like Google...
Ducksboard is a cloud-based business intelligence and data visualization platform used by companies to monitor key performance indicators and other metrics in real-time. It allows users to create customizable dashboards using a drag-and-drop interface and various widget types like charts, graphs, gauges, tables, and more.Some key features of Ducksboard include:Real-time...
Muralio is a leading digital workspace for visual collaboration in agile teams. It provides an infinite, cloud-based digital canvas that facilitates remote design thinking sessions, workshops, brainstorms, and ideation for distributed teams across the enterprise.Key features include:Virtual sticky notes, drawings, diagrams, frames for storyboardingTemplates for agile ceremonies like retrospectives, design...
Analytics Portfolio is a flexible business intelligence and analytics solution designed to help companies of all sizes gain deeper insights from their data. Some key features and benefits of Analytics Portfolio include:Interactive dashboards and reports - Users can create customized dashboards with drag-and-drop simplicity to visualize key metrics and KPIs....
Reportei is an open-source business intelligence and analytics platform used to visualize, analyze and share data through interactive dashboards, reports and graphs. It provides an intuitive drag-and-drop interface that allows non-technical users to easily create rich, interactive reports and dashboards.Some key features of Reportei include:Interactive dashboards with advanced visualizations like...
Canecto is an open-source software package for building online communities and social networks. It provides a range of features to help sites encourage user engagement and interaction.Some of the key features of Canecto include:User profiles - Members can create personal profile pages with photos, biographical info, interests etc.Forums - Category-based...
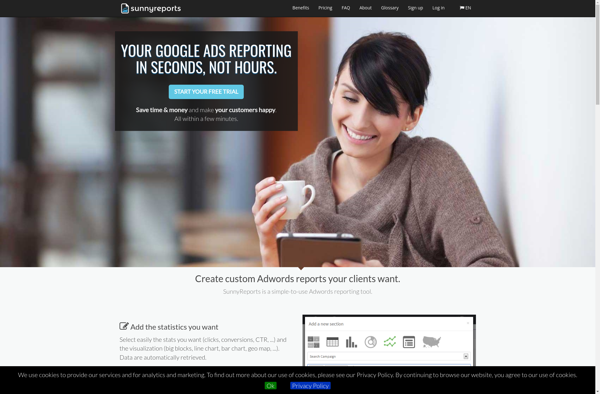
Sunnyreports is an open-source business intelligence and reporting solution designed to help companies gain better insights from their data. Here are some key capabilities of Sunnyreports:Intuitive drag-and-drop interface to build interactive reports and dashboards without codingConnectors to integrate data from SQL, NoSQL databases, cloud apps like Google Analytics, etc.Diverse visualization...
Pulse Metrics is a powerful web analytics platform designed to help businesses understand how users interact with their website or application. The software provides real-time and historical data on traffic sources, visitor behavior, conversions, and more to inform decision making.Key features of Pulse Metrics include:Intuitive dashboards and reports to visualize...