Everview is a visual software collaboration platform that provides real-time feedback and review capability. It allows teams to collaborate on designs, documents, websites, and visual assets in one place, enabling efficient workflows and easy sharing of feedback.
Real-time feedback and review capability for team collaboration on designs, documents, websites, and visual assets in one place, enhancing efficient workflows and easy sharing of feedback.
What is Everview?
Everview is a visual collaboration software designed to simplify the design review and feedback process for teams. It provides a single online space to upload, discuss, and iterate on any visual content, including design files, documents, websites, presentations, and more.
Some key features of Everview include:
Real-time commenting and annotation tools for giving visual feedback directly on the design/document
Contextual conversations to easily discuss feedback and resolve comments
Version history and visual diff tools to track changes across drafts
Integrations with design tools like Figma, Adobe Creative Cloud, Sketch, and more to streamline file management
Advanced security controls, role-based permissions, and priority support from Everview's customer success team
With its focus on enabling collaboration through visual communication, Everview aims to remove bottlenecks in the review process. Reviewers can mark up files in real-time instead of going back and forth on feedback asynchronously. The consolidated platform also cuts down on email threads, keeping all discussions centralized in context. This improves transparency, speeds up decision making, and ultimately accelerates release cycles.
Everview positions itself as a must-have productivity tool for design and marketing teams. It's commonly used by agencies, enterprises, product studios, and media firms that need to collaborate visually at scale.
Everview Features
Features
Real-time collaboration
Visual feedback tools
Version history
Integrations with design tools
Screen and video sharing
Commenting and annotations
Task management
Pricing
Freemium
Subscription-Based
Pros
Streamlines design review process
Enables remote collaboration
Integrates with popular design tools
Organizes feedback and revisions
Improves team communication
Cons
Can be pricey for small teams
Missing some features of dedicated project management tools
Microsoft Power BI is a powerful business analytics service developed by Microsoft. It empowers users to transform raw data into meaningful insights, create interactive reports and dashboards, and share data-driven stories within an organization. Power BI is designed to help businesses and individuals make informed decisions based on a comprehensive...
iot-dashboard is an open-source Internet of Things (IoT) data visualization and monitoring web application. It provides an intuitive graphical interface that allows users to easily create customizable dashboards to visualize and monitor data from IoT devices, sensors, and other data sources in real-time.Some key features of iot-dashboard include:Support for connecting...
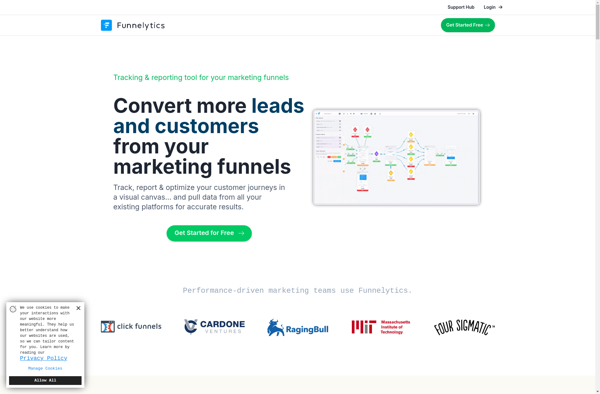
Funnelytics is a comprehensive marketing analytics platform designed to help businesses visualize and optimize their conversion funnels and customer journeys. It integrates data from multiple sources like websites, ads, CRM systems, etc. to create a single customer view.Key features of Funnelytics include:Interactive conversion funnel analysis to identify sticking points and...
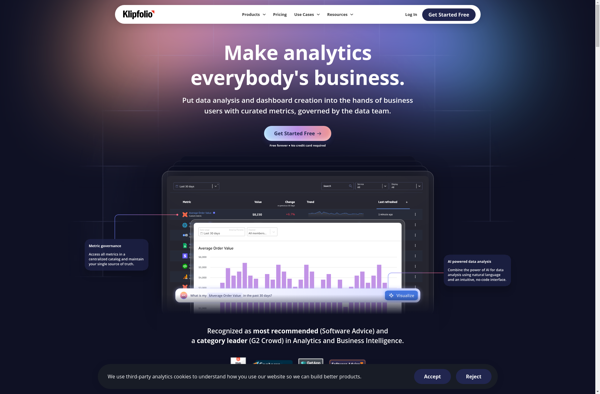
Klipfolio PowerMetrics is a flexible, cloud-based business intelligence and data visualization platform designed to help businesses gain insights from their data. Some key features include:Customizable dashboards - Users can build interactive dashboards with charts, graphs, tables, images and more to visualize key data.Real-time data connectivity - Connect to cloud apps,...
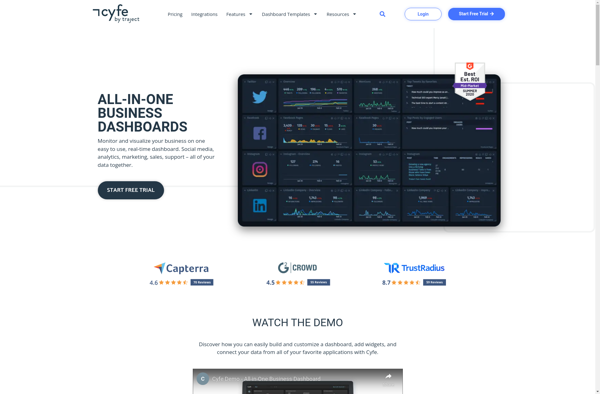
Cyfe is a powerful yet easy-to-use business dashboard and data visualization platform designed to help companies track, analyze, and visualize key performance indicators from all areas of their business. As an all-in-one solution, Cyfe eliminates the need to login to multiple accounts by integrating directly with popular business apps and...
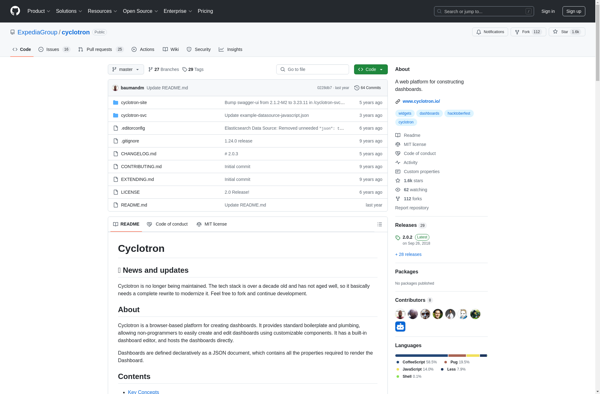
Cyclotron is an open-source task management and productivity application for Windows, macOS, and Linux operating systems. It provides users with a flexible framework to organize individual tasks as well as larger projects.Key features of Cyclotron include:Custom categories, tags, milestones, and workflows to categorize tasks and structure projectsCalendar and reminder system...
Freeboard is an open-source business intelligence and data visualization software. It provides an intuitive drag-and-drop interface that allows users to visualize data from multiple sources, without needing to code. Some key features of Freeboard include:Connectivity to a variety of data sources like SQL databases, REST APIs, MQTT, and moreLibrary of...
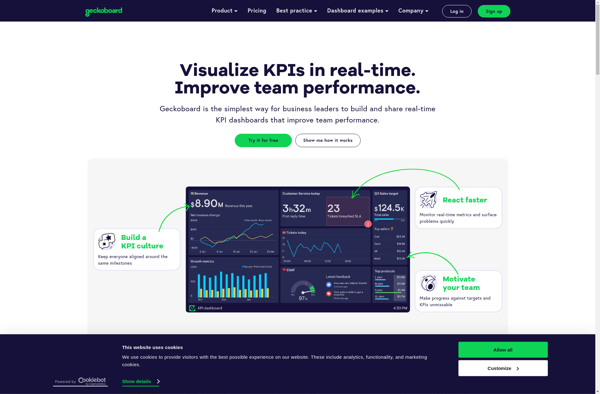
Geckoboard is a cloud-based business intelligence and data visualization platform used by over 30,000 companies worldwide. It allows users to build interactive TV dashboards that bring together data from various sources, both within a company and from external applications, to provide real-time visibility into critical metrics.Geckoboard integrates with 100+ data...
SumAll is a cloud-based social media analytics platform designed to help marketers and businesses aggregate and analyze data from multiple social media channels. It pulls metrics from popular platforms like Facebook, Twitter, Instagram, YouTube, and LinkedIn into one centralized dashboard to give users a holistic view of their social media...
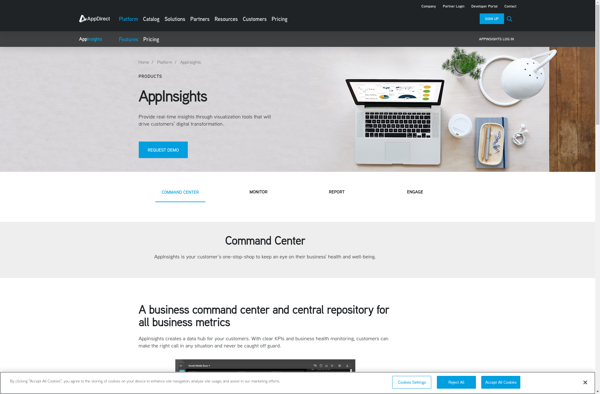
AppInsights is an extensive application performance management (APM) service provided by Microsoft Azure. It allows developers to easily monitor their live web applications and track key metrics like response time, failure rates, dependency rates, and more. Some key capabilities of AppInsights:Monitor response time, failure rates, exceptions to identify performance issues...
Freeboard.io is an intuitive drag-and-drop dashboard builder that allows you to visualize data from various sources in real-time, without needing to write any code. It's open-source and completely free to use.Some key features of Freeboard.io:Connects to a wide variety of data sources - You can pull data from MySQL, PostgreSQL,...
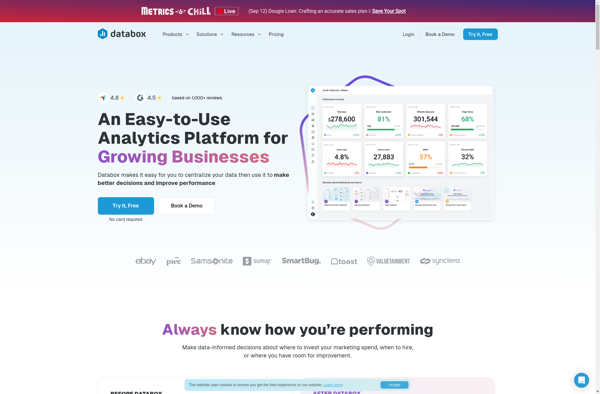
Databox is an open-source personal data platform that enables individuals to manage their personal data securely and privately. Developed by researchers at Imperial College London and the University of Cambridge, Databox allows users to connect data sources like smartphones, wearables, and web apps to feed data into the platform.Once data...
Whatagraph is a robust yet easy-to-use data visualization and reporting platform suitable for business users of all backgrounds. With an intuitive drag-and-drop interface, anyone can create interactive dashboards, charts, maps, and graphs that automatically update when data changes.Whatagraph connects directly to data sources like MySQL, PostgreSQL, Excel, Google Sheets, and...
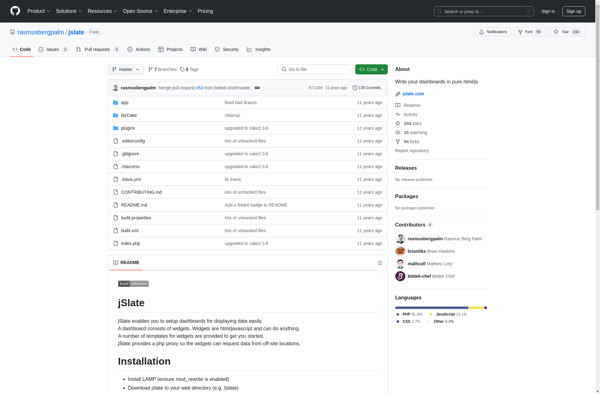
jSlate is an open-source vector graphics and diagramming web application for creating a wide variety of diagrams and sketches. With its intuitive drag-and-drop interface, jSlate makes it easy for users to construct flowcharts, UML diagrams, user interface mockups, network diagrams, organizational charts, and more.Some key features of jSlate include:Drag-and-drop shapes...
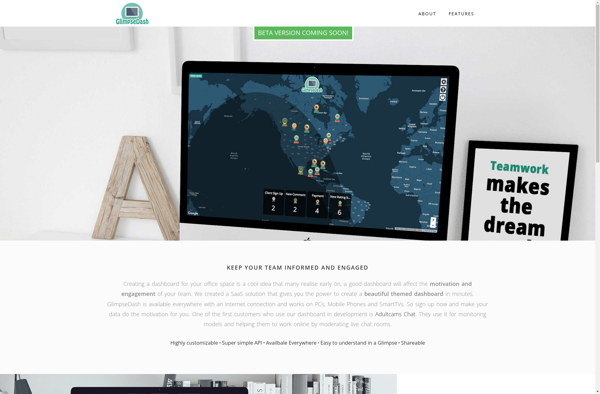
GlimpseDash is a business intelligence and analytics software designed to help companies visualize, analyze, and share data insights. Some key features include:Customizable dashboards with drag-and-drop widget builderHundreds of customizable chart and graph optionsSingle dashboard connected to multiple data sourcesReal-time updates to dashboards as data changesCollaboration tools to share dashboards and...
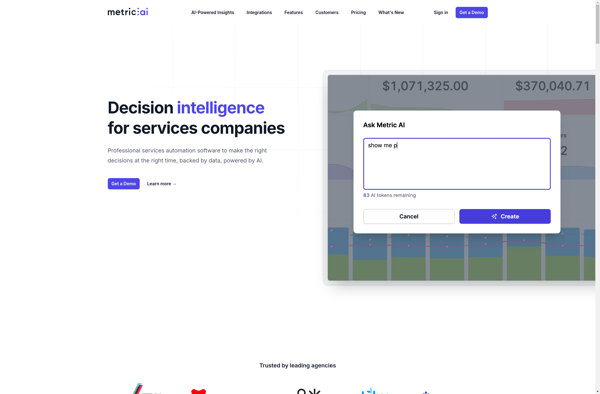
Metric.ai is an artificial intelligence-powered conversation intelligence platform designed to help businesses understand and improve customer experience. It analyzes conversations from sources like customer support transcripts, survey verbatims, and product reviews using natural language processing and machine learning.Key features of Metric.ai include:Powerful search and analysis of customer conversations at scaleAutomatic...
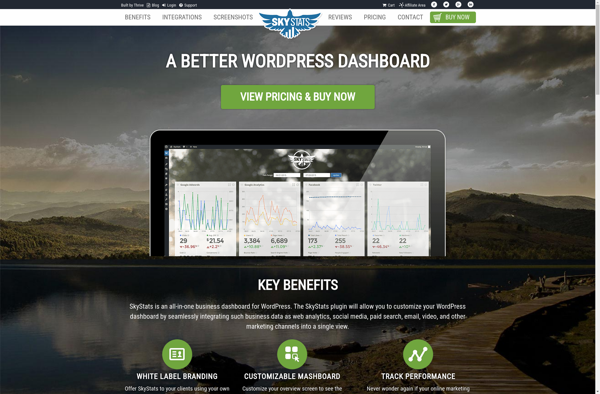
SkyStats is a robust statistics and analytics platform built to provide photographers, creative agencies, and media professionals with deep insights into their business and audience. As an all-in-one solution, SkyStats tracks website traffic, social media engagement, email marketing metrics, online sales, and more to uncover trends and opportunities for growth.Key...
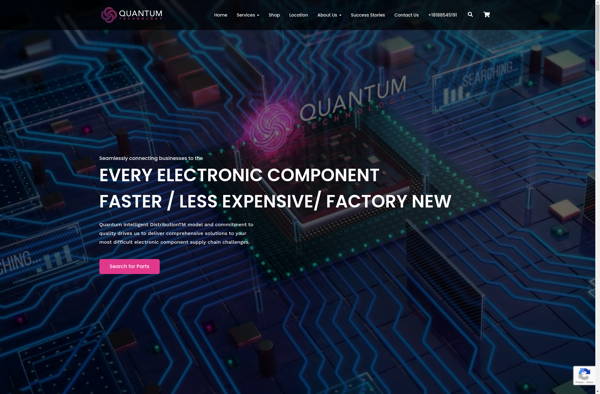
Quantum.io is a cloud-based artificial intelligence platform designed to make building and deploying AI solutions faster, easier, and more accessible. The platform includes tools and services for the full AI lifecycle:- Data integration services allow users to securely connect data sources like databases, cloud storage, APIs, and more to Quantum's...
Traken is a business intelligence and analytics platform designed to help companies manage their data pipelines, workflows, and analytics. It provides an intuitive drag-and-drop interface for ingesting data from various sources, processing and transforming it, and analyzing and visualizing it through interactive dashboards.Some key capabilities and benefits of Traken include:Flexible...
DataHero is a cloud-based business intelligence and analytics platform targeted at non-technical business users. It aims to make BI and data analytics accessible without needing expertise in data science or coding.Key capabilities and benefits of DataHero include:Intuitive drag-and-drop interface to build interactive dashboards and reports visualizing key business metricsConnectors to...
Web Control Room is a powerful yet easy-to-use web analytics platform designed for small to medium businesses. It gives comprehensive insights into website visitors and traffic sources along with tools to identify qualified leads and optimize conversion funnels.With Web Control Room, businesses can:Track visitors and pageviews to understand website usage...
Oktopus is an open-source browser automation and web scraping tool written in Python. It provides an easy way to control web browsers like Chrome and Firefox programmatically for tasks like scraping data from websites or automating UI tests.Some key features of Oktopus include:Simple API for navigating to web pages, finding...
Xapsys Live is a user-friendly live chat and messaging software designed for small and medium sized businesses. It enables companies to have real-time conversations with visitors on their website in order to provide instant support and improve sales.Key features of Xapsys Live include:Real-time chat window - Chat with website visitors...
Informly is a robust customer feedback and product reviews software designed to help companies better understand and act on customer opinions. It includes the following key features:NPS Surveys - Send customized Net Promoter Score surveys via email and SMS to measure customer loyalty.In-App Surveys - Embed feedback forms directly into...
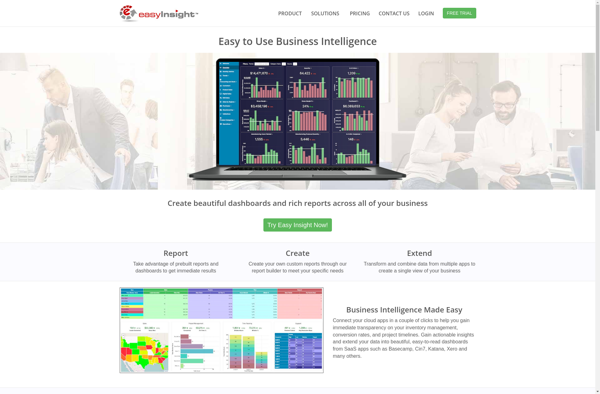
Easy Insight is a business intelligence and data analytics solution built specifically for small and medium-sized enterprises. It enables companies to connect data from multiple sources, build interactive reports and dashboards, and gain actionable insights to optimize business performance.Some key features of Easy Insight include:Intuitive drag-and-drop interface for self-service analyticsPre-built...