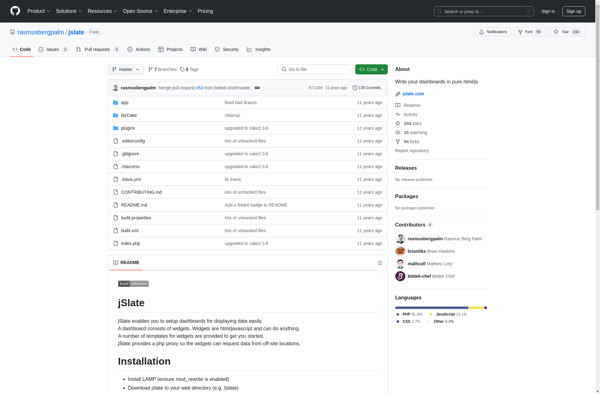
jSlate is an open-source vector graphics and diagramming web application. It allows users to create flowcharts, UML diagrams, network diagrams, mockups, and more. jSlate has a simple and intuitive drag-and-drop interface for constructing diagrams quickly.
Create flowcharts, UML diagrams, network diagrams, mockups & more with jSlate's intuitive drag-and-drop interface - an open-source web application.
What is JSlate?
jSlate is an open-source vector graphics and diagramming web application for creating a wide variety of diagrams and sketches. With its intuitive drag-and-drop interface, jSlate makes it easy for users to construct flowcharts, UML diagrams, user interface mockups, network diagrams, organizational charts, and more.
Some key features of jSlate include:
Drag-and-drop shapes and connectors for quick diagram construction
Undo/redo capabilities
Export diagrams as PNG, JPEG, SVG, PDF files
Real-time collaboration - allows multiple users to edit the same diagram simultaneously
Touch-friendly interface that works well on tablets and mobile devices
Supports creating custom shapes, stencils, and templates
Completely open-source and available on GitHub
With its focus on usability and collaboration, jSlate is a great option for teams that need to create detailed diagrams for documentation, Wireframing, or brainstorming sessions. Its availability as a web app means no software installs are required to start creating diagrams. The open-source nature also allows customization and integration into existing infrastructure.
JSlate Features
Features
Drag-and-drop interface
Diagramming tools for flowcharts, UML diagrams, network diagrams, mockups, etc
Real-time collaboration
Import/export SVG files
Keyboard shortcuts
Touch support
Open-source
Pricing
Open Source
Free
Pros
Intuitive and easy to use
Good for quick diagramming needs
Collaboration features
Free and open-source
Cons
Limited features compared to desktop apps like Visio
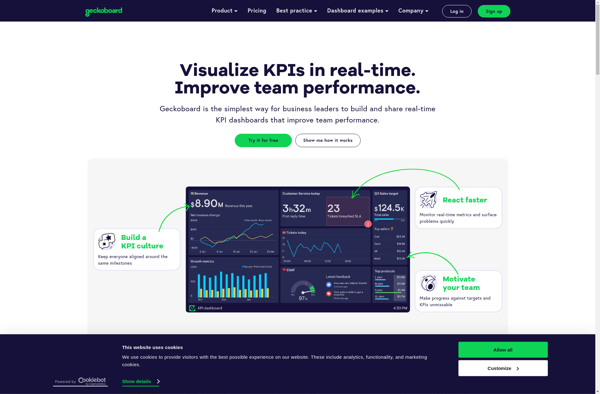
Geckoboard is a cloud-based business intelligence and data visualization platform used by over 30,000 companies worldwide. It allows users to build interactive TV dashboards that bring together data from various sources, both within a company and from external applications, to provide real-time visibility into critical metrics.Geckoboard integrates with 100+ data...
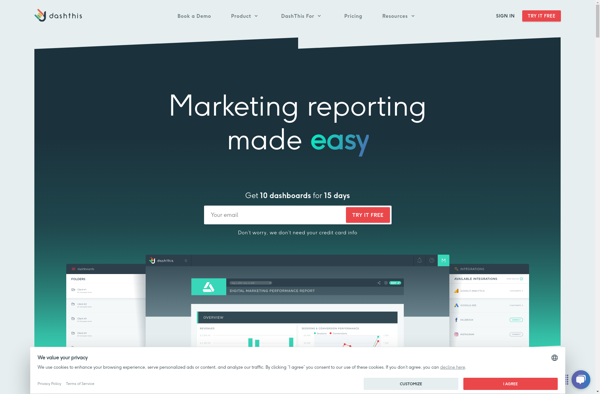
DashThis is a user-friendly project management and task tracking application designed for small teams and businesses. It provides an intuitive interface to plan projects, create tasks, set due dates, assign work to team members, track progress, and collaborate with others.Some key features of DashThis include:Flexible project views - See all...
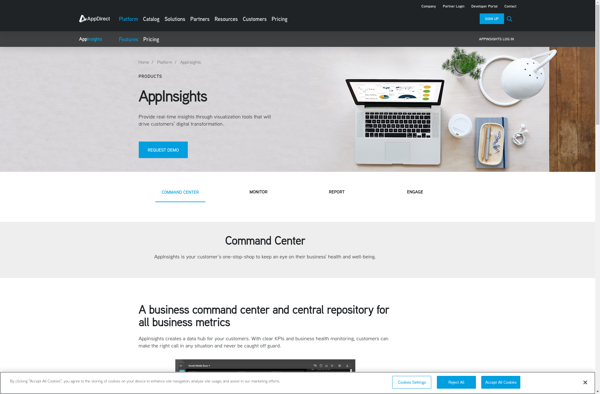
AppInsights is an extensive application performance management (APM) service provided by Microsoft Azure. It allows developers to easily monitor their live web applications and track key metrics like response time, failure rates, dependency rates, and more. Some key capabilities of AppInsights:Monitor response time, failure rates, exceptions to identify performance issues...
Tuck is a browser extension available for Google Chrome, Firefox, and Safari that aims to provide users with a decluttered browsing experience. Its main goal is to remove distracting elements from web pages like ads, pop-ups, notifications, and other clutter so users can focus on a site's core content.Once installed,...
Freeboard.io is an intuitive drag-and-drop dashboard builder that allows you to visualize data from various sources in real-time, without needing to write any code. It's open-source and completely free to use.Some key features of Freeboard.io:Connects to a wide variety of data sources - You can pull data from MySQL, PostgreSQL,...
Notion Analytics is a business intelligence and data visualization software used by organizations to create visually appealing dashboards connected to various databases and analytics tools. It has an intuitive drag-and-drop interface that enables users to model data and build reports and dashboards without needing to code.Key features of Notion Analytics...
ClicData is a business intelligence and data visualization software designed to help companies make better data-driven decisions. It allows users without technical backgrounds to easily connect to data sources like databases, cloud apps, or Excel files, and build interactive dashboards and reports to gain insights.Some key features of ClicData include:Drag-and-drop...
Qlik Sense is a business intelligence and analytics platform designed for modern, self-service oriented analytics. It allows users of all skill levels to easily create interactive data visualizations, dashboards, and applications to gain insights from multiple data sources.Some key features of Qlik Sense include:Associative data model and in-memory analytics engine...
Everview is a visual collaboration software designed to simplify the design review and feedback process for teams. It provides a single online space to upload, discuss, and iterate on any visual content, including design files, documents, websites, presentations, and more.Some key features of Everview include:Real-time commenting and annotation tools for...
Dashing is an open-source web application dashboard framework that allows developers and non-developers alike to build beautiful, real-time dashboards. It provides a simple way to organize and monitor complex data, making it easy to visualize and share key metrics and insights.Dashing is built on top of the Sinatra web framework...
Ducksboard is a cloud-based business intelligence and data visualization platform used by companies to monitor key performance indicators and other metrics in real-time. It allows users to create customizable dashboards using a drag-and-drop interface and various widget types like charts, graphs, gauges, tables, and more.Some key features of Ducksboard include:Real-time...
Web Control Room is a powerful yet easy-to-use web analytics platform designed for small to medium businesses. It gives comprehensive insights into website visitors and traffic sources along with tools to identify qualified leads and optimize conversion funnels.With Web Control Room, businesses can:Track visitors and pageviews to understand website usage...
HappyMetrix Dashboards is a flexible business intelligence and data visualization solution designed to help companies gain insights from their data. It allows users without technical expertise to easily connect multiple data sources, create interactive dashboards and data visualizations, and share insights across the organization.Some key features of HappyMetrix Dashboards include:Drag-and-drop...
FinalBoard is a flexible project management software designed for agile teams. It provides tools to plan projects, break down work into manageable tasks, track progress, and collaborate across teams.Key features of FinalBoard include:Interactive kanban boards to visualize work and track progressCustomizable workflows and automation to match any processFlexible task and...
Informly is a robust customer feedback and product reviews software designed to help companies better understand and act on customer opinions. It includes the following key features:NPS Surveys - Send customized Net Promoter Score surveys via email and SMS to measure customer loyalty.In-App Surveys - Embed feedback forms directly into...