ClicData

ClicData

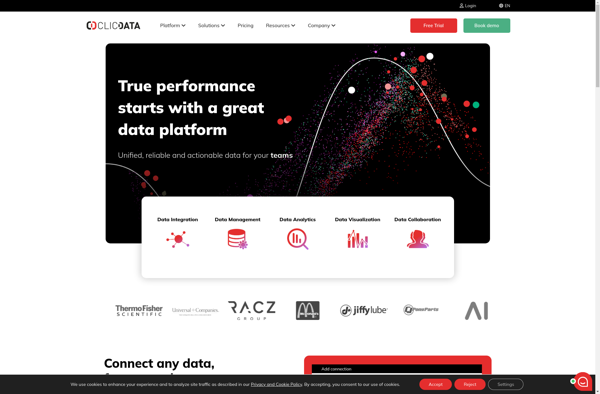
ClicData is a business intelligence and data visualization software that allows users to connect to various data sources, build interactive dashboards and reports, and share insights through visual analytics. It's designed to be easy-to-use for non-technical users.
ClicData image
data-visualization dashboards reports analytics

ClicData: Business Intelligence and Data Visualization Software

ClicData is a business intelligence and data visualization software that allows users to connect to various data sources, build interactive dashboards and reports, and share insights through visual analytics. It's designed to be easy-to-use for non-technical users.

What is ClicData?

ClicData is a business intelligence and data visualization software designed to help companies make better data-driven decisions. It allows users without technical backgrounds to easily connect to data sources like databases, cloud apps, or Excel files, and build interactive dashboards and reports to gain insights.

Some key features of ClicData include:

  • Drag-and-drop interface to create dashboards with charts, tables, filters, and KPIs
  • Library of customizable widget templates for visualizations
  • AI-powered natural language queries to ask questions about data
  • Scheduled dashboard refreshes and report distributions
  • Access controls and permissions to ensure data governance
  • APIs and integrations with other apps like Slack, Power BI, and Tableau

ClicData is designed to democratize business intelligence across organizations so any employee can self-serve insights, not just analysts. Its intuitive interface unlocks data for faster and better decision making. With interactive dashboards updated in real-time, non-technical users can easily spot trends and opportunities.

Some common uses cases include sales reporting, marketing analytics, supply chain analytics, financial reporting, ecommerce analytics, healthcare analytics, and more. ClicData aims to make complex data and analytics simple for companies of all sizes.

ClicData Features

Features

  1. Drag-and-drop interface to build dashboards
  2. Connects to various data sources like SQL, NoSQL, cloud apps
  3. Has prebuilt templates and widgets for dashboards
  4. Allows data blending from multiple sources
  5. Has sharing and collaboration features
  6. Offers dynamic and interactive visualizations
  7. Has scheduling and alerting capabilities

Pricing

  • Freemium
  • Subscription-Based

Pros

User-friendly interface

Requires no coding knowledge

Fast and easy dashboard creation

Powerful data visualization capabilities

Scales to large data volumes

Affordable pricing

Cons

Limited customization compared to developer-oriented BI tools

Not ideal for complex data modeling and transformations

Lacks some advanced analytics features like forecasting

Can be slow with very large datasets


The Best ClicData Alternatives

Top Business & Commerce and Business Intelligence & Analytics and other similar apps like ClicData


Klipfolio PowerMetrics icon

Klipfolio PowerMetrics

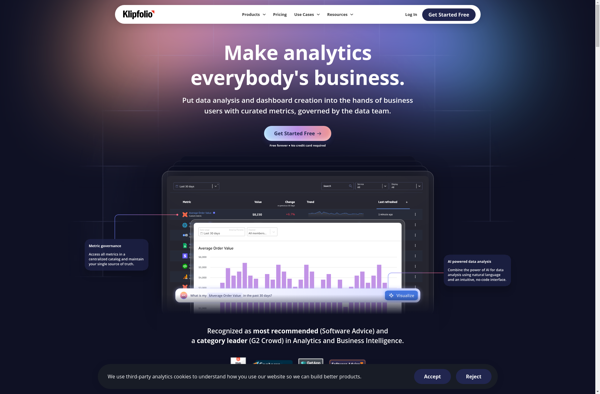
Klipfolio PowerMetrics is a flexible, cloud-based business intelligence and data visualization platform designed to help businesses gain insights from their data. Some key features include:Customizable dashboards - Users can build interactive dashboards with charts, graphs, tables, images and more to visualize key data.Real-time data connectivity - Connect to cloud apps,...
Klipfolio PowerMetrics image
Cyfe icon

Cyfe

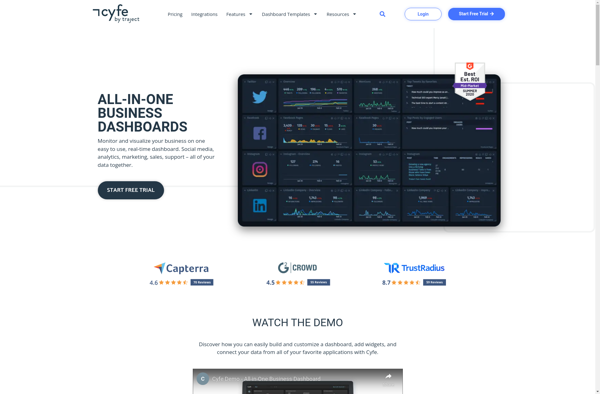
Cyfe is a powerful yet easy-to-use business dashboard and data visualization platform designed to help companies track, analyze, and visualize key performance indicators from all areas of their business. As an all-in-one solution, Cyfe eliminates the need to login to multiple accounts by integrating directly with popular business apps and...
Cyfe image
Cyclotron icon

Cyclotron

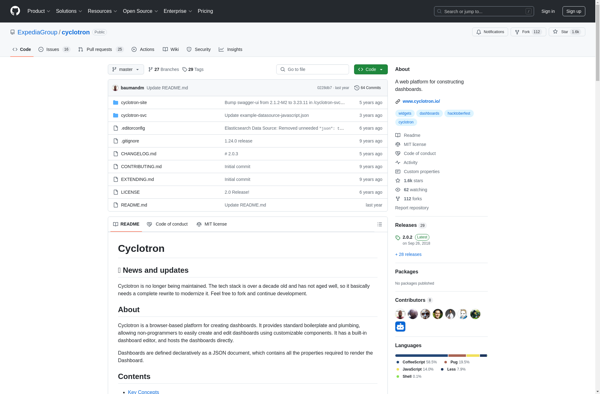
Cyclotron is an open-source task management and productivity application for Windows, macOS, and Linux operating systems. It provides users with a flexible framework to organize individual tasks as well as larger projects.Key features of Cyclotron include:Custom categories, tags, milestones, and workflows to categorize tasks and structure projectsCalendar and reminder system...
Cyclotron image
Cluvio icon

Cluvio

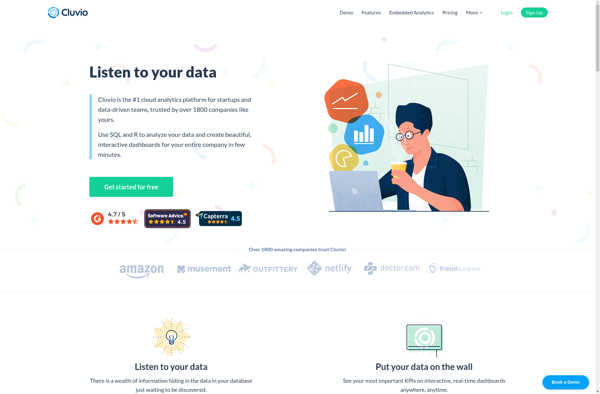
Cluvio is a business intelligence and analytics software designed for small and medium-sized businesses. It aims to make data analytics accessible to non-technical users through an intuitive graphical interface. Some key capabilities and benefits of Cluvio include:Interactive dashboards - Users can create customizable dashboards to visualize important business metrics and...
Cluvio image
Freeboard icon

Freeboard

Freeboard is an open-source business intelligence and data visualization software. It provides an intuitive drag-and-drop interface that allows users to visualize data from multiple sources, without needing to code. Some key features of Freeboard include:Connectivity to a variety of data sources like SQL databases, REST APIs, MQTT, and moreLibrary of...
Geckoboard icon

Geckoboard

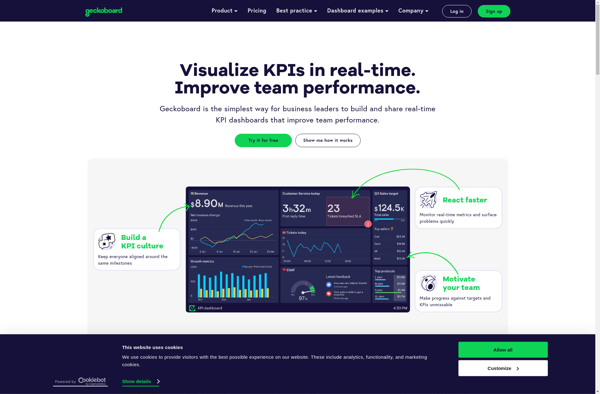
Geckoboard is a cloud-based business intelligence and data visualization platform used by over 30,000 companies worldwide. It allows users to build interactive TV dashboards that bring together data from various sources, both within a company and from external applications, to provide real-time visibility into critical metrics.Geckoboard integrates with 100+ data...
Geckoboard image
Stashboard icon

Stashboard

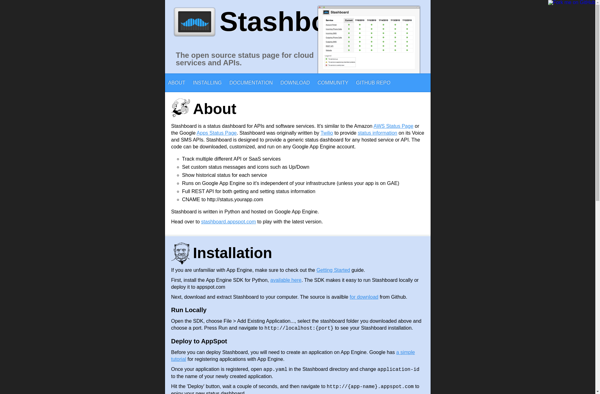
Stashboard is an open-source status dashboard application written in Python using the Django web framework. It is designed to be lightweight, customizable and easy to set up to display the status of various services on a simple web interface.Some key features of Stashboard include:Simple and clean visual status display showing...
Stashboard image
SumAll icon

SumAll

SumAll is a cloud-based social media analytics platform designed to help marketers and businesses aggregate and analyze data from multiple social media channels. It pulls metrics from popular platforms like Facebook, Twitter, Instagram, YouTube, and LinkedIn into one centralized dashboard to give users a holistic view of their social media...
DashThis icon

DashThis

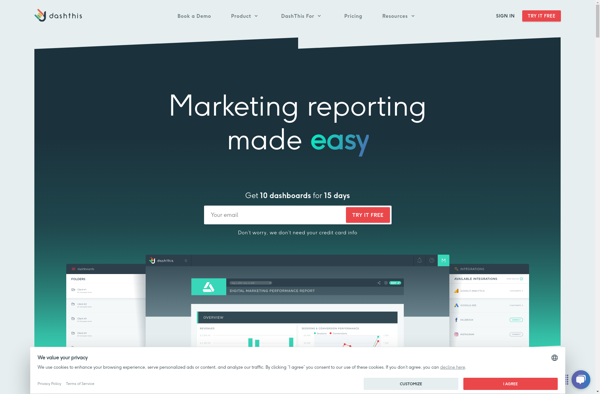
DashThis is a user-friendly project management and task tracking application designed for small teams and businesses. It provides an intuitive interface to plan projects, create tasks, set due dates, assign work to team members, track progress, and collaborate with others.Some key features of DashThis include:Flexible project views - See all...
DashThis image
AppInsights icon

AppInsights

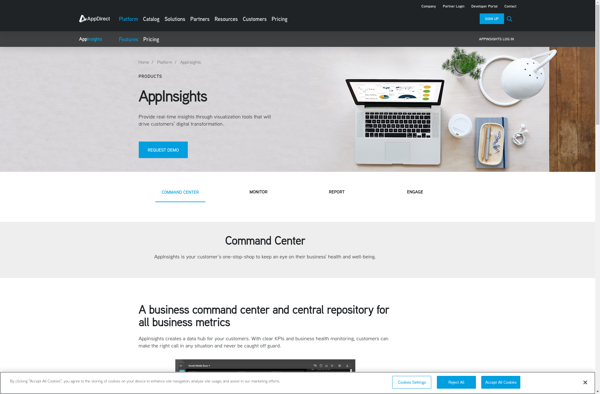
AppInsights is an extensive application performance management (APM) service provided by Microsoft Azure. It allows developers to easily monitor their live web applications and track key metrics like response time, failure rates, dependency rates, and more. Some key capabilities of AppInsights:Monitor response time, failure rates, exceptions to identify performance issues...
AppInsights image
JSlate icon

JSlate

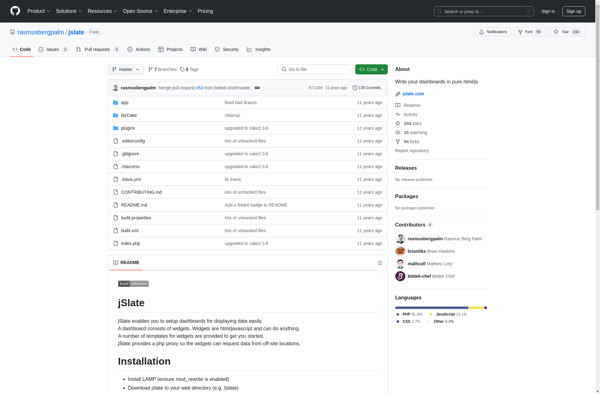
jSlate is an open-source vector graphics and diagramming web application for creating a wide variety of diagrams and sketches. With its intuitive drag-and-drop interface, jSlate makes it easy for users to construct flowcharts, UML diagrams, user interface mockups, network diagrams, organizational charts, and more.Some key features of jSlate include:Drag-and-drop shapes...
JSlate image
Dashing icon

Dashing

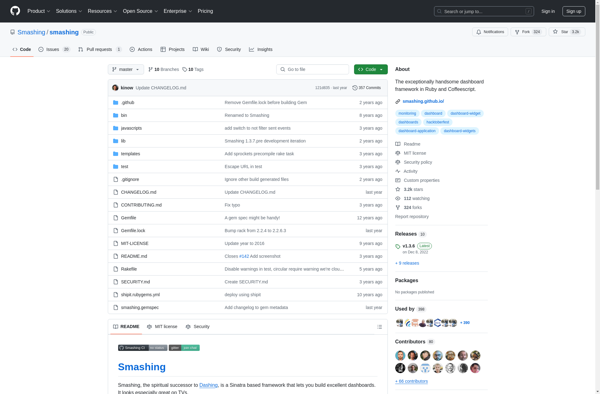
Dashing is an open-source web application dashboard framework that allows developers and non-developers alike to build beautiful, real-time dashboards. It provides a simple way to organize and monitor complex data, making it easy to visualize and share key metrics and insights.Dashing is built on top of the Sinatra web framework...
Dashing image
Web Control Room icon

Web Control Room

Web Control Room is a powerful yet easy-to-use web analytics platform designed for small to medium businesses. It gives comprehensive insights into website visitors and traffic sources along with tools to identify qualified leads and optimize conversion funnels.With Web Control Room, businesses can:Track visitors and pageviews to understand website usage...
Web Control Room image
Xapsys Live icon

Xapsys Live

Xapsys Live is a user-friendly live chat and messaging software designed for small and medium sized businesses. It enables companies to have real-time conversations with visitors on their website in order to provide instant support and improve sales.Key features of Xapsys Live include:Real-time chat window - Chat with website visitors...
Xapsys Live image
FinalBoard icon

FinalBoard

FinalBoard is a flexible project management software designed for agile teams. It provides tools to plan projects, break down work into manageable tasks, track progress, and collaborate across teams.Key features of FinalBoard include:Interactive kanban boards to visualize work and track progressCustomizable workflows and automation to match any processFlexible task and...
FinalBoard image
Informly icon

Informly

Informly is a robust customer feedback and product reviews software designed to help companies better understand and act on customer opinions. It includes the following key features:NPS Surveys - Send customized Net Promoter Score surveys via email and SMS to measure customer loyalty.In-App Surveys - Embed feedback forms directly into...
Informly image