Web Control Room is a web analytics software that helps businesses track website traffic and monitor key metrics. It provides easy-to-interpret reports on visitors, conversions, sales funnel analytics, and more to optimize marketing efforts.
Web Control Room is a web analytics software that helps businesses track website traffic and monitor key metrics. It provides easy-to-interpret reports on visitors, conversions, sales funnel analytics, and more to optimize marketing efforts.
What is Web Control Room?
Web Control Room is a powerful yet easy-to-use web analytics platform designed for small to medium businesses. It gives comprehensive insights into website visitors and traffic sources along with tools to identify qualified leads and optimize conversion funnels.
With Web Control Room, businesses can:
Track visitors and pageviews to understand website usage and traffic trends over time
Identify the most productive traffic sources driving website visits
Set up goals and conversion funnels to measure ROI of marketing campaigns
Segment audiences to target content to specific visitor groups
Generate customized analytic reports on traffic, leads, sales and more
Integrate data with other business apps like CRM and marketing automation systems
A user-friendly drag-and-drop dashboard makes it easy for non-techies to access analytics and share key metrics across teams. Advanced features like heatmaps, A/B testing, and funnel optimization provide the capabilities needed to fine-tune conversion strategies.
With powerful and affordable plans suitable for all business sizes, Web Control Room brings enterprise-grade analytics within reach of SMBs looking to accelerate growth.
Web Control Room Features
Features
Real-time website analytics
Customizable dashboards
Sales funnel tracking
Goal and conversion tracking
Heatmaps
A/B testing
Session recordings
Form analytics
Custom reporting
API access
Pricing
Freemium
Subscription-Based
Pros
Intuitive and easy to use interface
Affordable pricing
Good customer support
Helpful onboarding and training
Integrates with many other software tools
Provides actionable insights to improve marketing ROI
Cons
Can be overwhelming for new users
Limited customization options for reports
Lacks some advanced features of enterprise-level tools
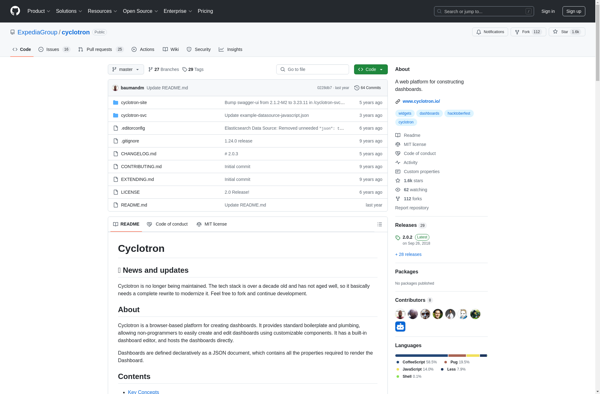
Cyclotron is an open-source task management and productivity application for Windows, macOS, and Linux operating systems. It provides users with a flexible framework to organize individual tasks as well as larger projects.Key features of Cyclotron include:Custom categories, tags, milestones, and workflows to categorize tasks and structure projectsCalendar and reminder system...
Freeboard is an open-source business intelligence and data visualization software. It provides an intuitive drag-and-drop interface that allows users to visualize data from multiple sources, without needing to code. Some key features of Freeboard include:Connectivity to a variety of data sources like SQL databases, REST APIs, MQTT, and moreLibrary of...
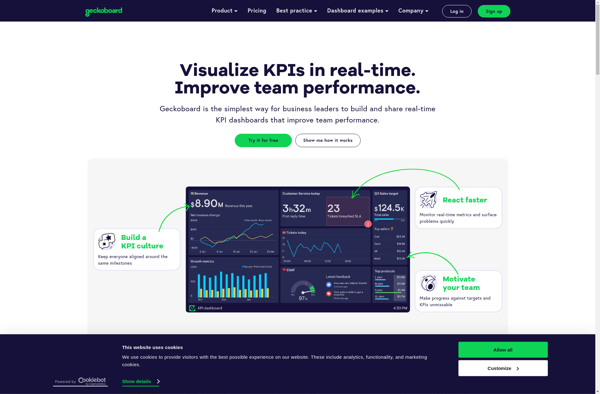
Geckoboard is a cloud-based business intelligence and data visualization platform used by over 30,000 companies worldwide. It allows users to build interactive TV dashboards that bring together data from various sources, both within a company and from external applications, to provide real-time visibility into critical metrics.Geckoboard integrates with 100+ data...
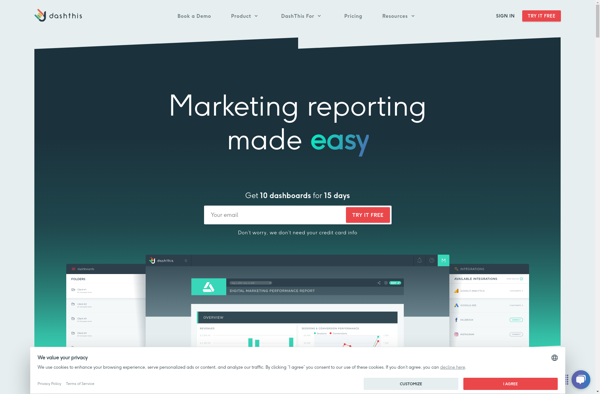
DashThis is a user-friendly project management and task tracking application designed for small teams and businesses. It provides an intuitive interface to plan projects, create tasks, set due dates, assign work to team members, track progress, and collaborate with others.Some key features of DashThis include:Flexible project views - See all...
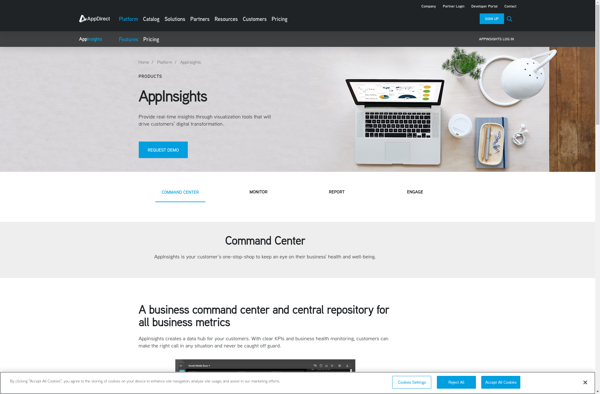
AppInsights is an extensive application performance management (APM) service provided by Microsoft Azure. It allows developers to easily monitor their live web applications and track key metrics like response time, failure rates, dependency rates, and more. Some key capabilities of AppInsights:Monitor response time, failure rates, exceptions to identify performance issues...
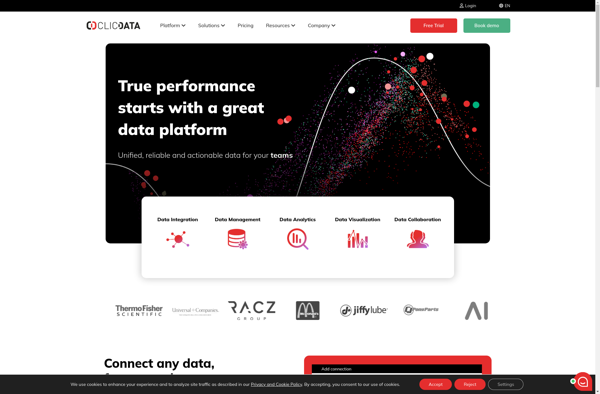
ClicData is a business intelligence and data visualization software designed to help companies make better data-driven decisions. It allows users without technical backgrounds to easily connect to data sources like databases, cloud apps, or Excel files, and build interactive dashboards and reports to gain insights.Some key features of ClicData include:Drag-and-drop...
Everview is a visual collaboration software designed to simplify the design review and feedback process for teams. It provides a single online space to upload, discuss, and iterate on any visual content, including design files, documents, websites, presentations, and more.Some key features of Everview include:Real-time commenting and annotation tools for...
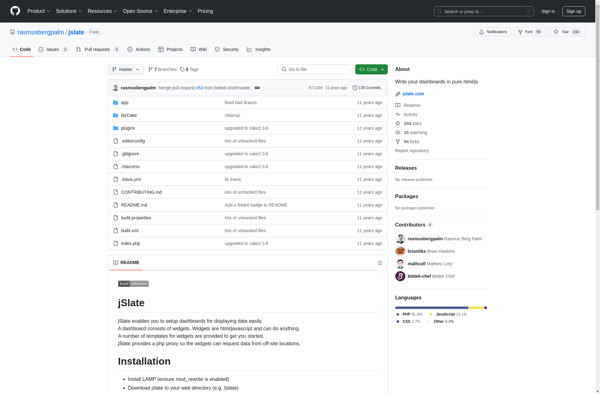
jSlate is an open-source vector graphics and diagramming web application for creating a wide variety of diagrams and sketches. With its intuitive drag-and-drop interface, jSlate makes it easy for users to construct flowcharts, UML diagrams, user interface mockups, network diagrams, organizational charts, and more.Some key features of jSlate include:Drag-and-drop shapes...
HappyMetrix Dashboards is a flexible business intelligence and data visualization solution designed to help companies gain insights from their data. It allows users without technical expertise to easily connect multiple data sources, create interactive dashboards and data visualizations, and share insights across the organization.Some key features of HappyMetrix Dashboards include:Drag-and-drop...
FinalBoard is a flexible project management software designed for agile teams. It provides tools to plan projects, break down work into manageable tasks, track progress, and collaborate across teams.Key features of FinalBoard include:Interactive kanban boards to visualize work and track progressCustomizable workflows and automation to match any processFlexible task and...