Cyclotron is an open-source desktop application for organizing tasks and projects. It allows users to create customizable workflows, categorize tasks, set reminders and deadlines, collaborate with others, and track progress.
A customizable desktop application for managing tasks, projects, workflows, collaboration, reminders, deadlines, and progress tracking.
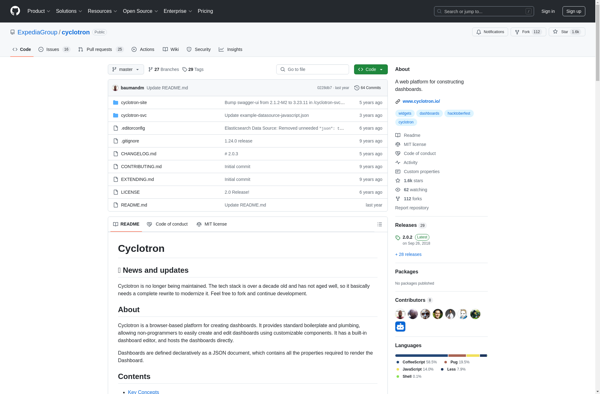
What is Cyclotron?
Cyclotron is an open-source task management and productivity application for Windows, macOS, and Linux operating systems. It provides users with a flexible framework to organize individual tasks as well as larger projects.
Key features of Cyclotron include:
Custom categories, tags, milestones, and workflows to categorize tasks and structure projects
Calendar and reminder system to set due dates and notifications for tasks
Progress tracking with customizable meters for individual tasks and whole projects
Hierarchies and dependencies between tasks to model sequences and relationships
Flexible filtering and search for quickly finding tasks
Note taking and document attachment to enrich tasks with additional information
Interfaces for time tracking and timesheets
Collaborative features like sharing task lists with others and comment threads
An open plugin ecosystem allows further customization and integration with third-party services. Cyclotron places no restrictions on task volume and is well-suited both for personal task management as well as coordinating team projects. Its intuitive design makes Cyclotron accessible yet powerful.
Grafana is a feature-rich, open source analytics and monitoring visualization suite. It integrates tightly with a variety of database technologies like Graphite, Prometheus, InfluxDB, Elasticsearch, and more to allow for easy exploration and visualization of time series data. Some key capabilities and benefits of Grafana include:Intuitive graphical UI makes it...
Microsoft Power BI is a powerful business analytics service developed by Microsoft. It empowers users to transform raw data into meaningful insights, create interactive reports and dashboards, and share data-driven stories within an organization. Power BI is designed to help businesses and individuals make informed decisions based on a comprehensive...
iot-dashboard is an open-source Internet of Things (IoT) data visualization and monitoring web application. It provides an intuitive graphical interface that allows users to easily create customizable dashboards to visualize and monitor data from IoT devices, sensors, and other data sources in real-time.Some key features of iot-dashboard include:Support for connecting...
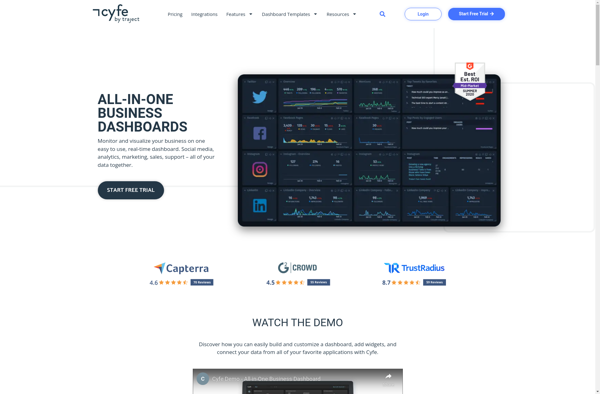
Cyfe is a powerful yet easy-to-use business dashboard and data visualization platform designed to help companies track, analyze, and visualize key performance indicators from all areas of their business. As an all-in-one solution, Cyfe eliminates the need to login to multiple accounts by integrating directly with popular business apps and...
Freeboard is an open-source business intelligence and data visualization software. It provides an intuitive drag-and-drop interface that allows users to visualize data from multiple sources, without needing to code. Some key features of Freeboard include:Connectivity to a variety of data sources like SQL databases, REST APIs, MQTT, and moreLibrary of...
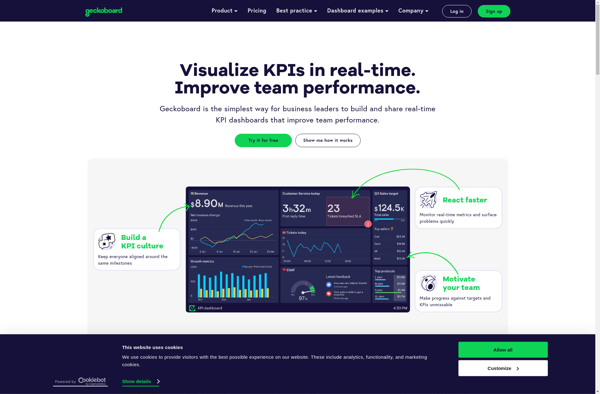
Geckoboard is a cloud-based business intelligence and data visualization platform used by over 30,000 companies worldwide. It allows users to build interactive TV dashboards that bring together data from various sources, both within a company and from external applications, to provide real-time visibility into critical metrics.Geckoboard integrates with 100+ data...
SumAll is a cloud-based social media analytics platform designed to help marketers and businesses aggregate and analyze data from multiple social media channels. It pulls metrics from popular platforms like Facebook, Twitter, Instagram, YouTube, and LinkedIn into one centralized dashboard to give users a holistic view of their social media...
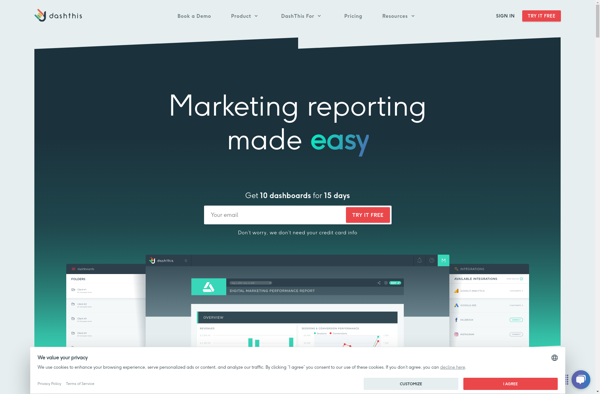
DashThis is a user-friendly project management and task tracking application designed for small teams and businesses. It provides an intuitive interface to plan projects, create tasks, set due dates, assign work to team members, track progress, and collaborate with others.Some key features of DashThis include:Flexible project views - See all...
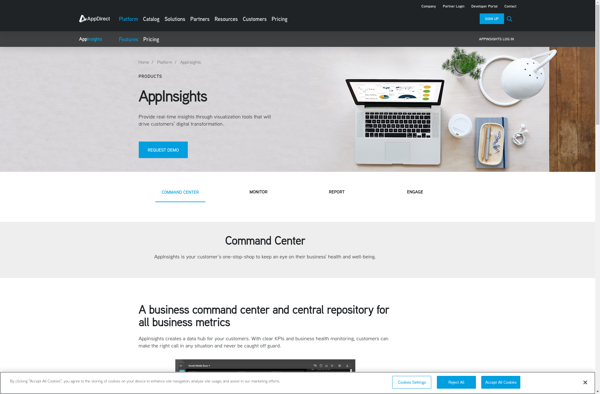
AppInsights is an extensive application performance management (APM) service provided by Microsoft Azure. It allows developers to easily monitor their live web applications and track key metrics like response time, failure rates, dependency rates, and more. Some key capabilities of AppInsights:Monitor response time, failure rates, exceptions to identify performance issues...
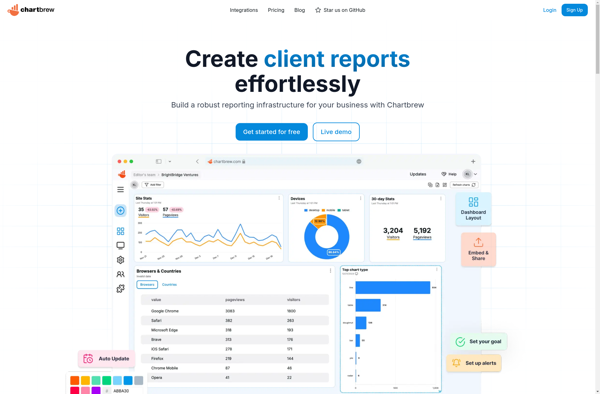
Chartbrew is an open-source business intelligence and data visualization platform used to analyze data and create interactive charts, graphs, and dashboards. It has an easy-to-use drag and drop interface that allows users to connect to SQL, NoSQL, CSV data sources, and SaaS applications to visualize data and find insights.Some key...
Notion Analytics is a business intelligence and data visualization software used by organizations to create visually appealing dashboards connected to various databases and analytics tools. It has an intuitive drag-and-drop interface that enables users to model data and build reports and dashboards without needing to code.Key features of Notion Analytics...
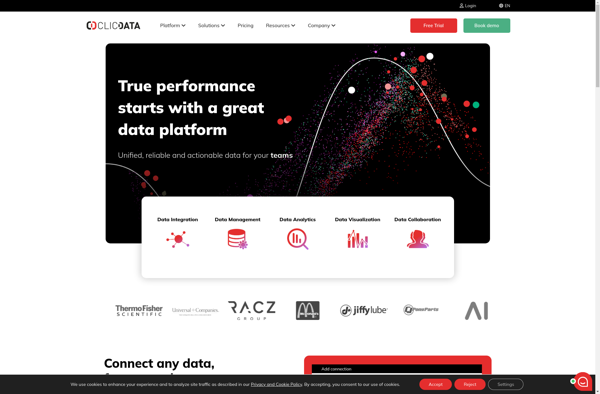
ClicData is a business intelligence and data visualization software designed to help companies make better data-driven decisions. It allows users without technical backgrounds to easily connect to data sources like databases, cloud apps, or Excel files, and build interactive dashboards and reports to gain insights.Some key features of ClicData include:Drag-and-drop...
Startegy is a comprehensive business strategy software designed to help organizations develop, execute, and manage their strategic plans effectively. It provides a centralized workspace for strategic planning and performance management.Key features of Startegy include:Objectives Management - Set organizational objectives, link them to overarching strategy, assign owners, and track progressStrategy Mapping...
Everview is a visual collaboration software designed to simplify the design review and feedback process for teams. It provides a single online space to upload, discuss, and iterate on any visual content, including design files, documents, websites, presentations, and more.Some key features of Everview include:Real-time commenting and annotation tools for...
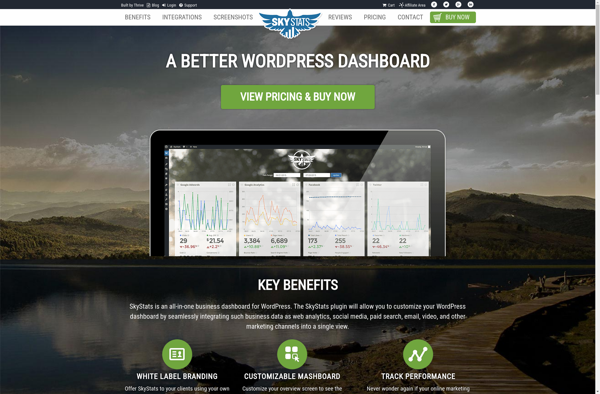
SkyStats is a robust statistics and analytics platform built to provide photographers, creative agencies, and media professionals with deep insights into their business and audience. As an all-in-one solution, SkyStats tracks website traffic, social media engagement, email marketing metrics, online sales, and more to uncover trends and opportunities for growth.Key...
Web Control Room is a powerful yet easy-to-use web analytics platform designed for small to medium businesses. It gives comprehensive insights into website visitors and traffic sources along with tools to identify qualified leads and optimize conversion funnels.With Web Control Room, businesses can:Track visitors and pageviews to understand website usage...
HappyMetrix Dashboards is a flexible business intelligence and data visualization solution designed to help companies gain insights from their data. It allows users without technical expertise to easily connect multiple data sources, create interactive dashboards and data visualizations, and share insights across the organization.Some key features of HappyMetrix Dashboards include:Drag-and-drop...
FinalBoard is a flexible project management software designed for agile teams. It provides tools to plan projects, break down work into manageable tasks, track progress, and collaborate across teams.Key features of FinalBoard include:Interactive kanban boards to visualize work and track progressCustomizable workflows and automation to match any processFlexible task and...