Grafana is an open source analytics and monitoring visualization tool. It allows you to query, visualize, alert on and understand metrics from various data sources like Prometheus, Elasticsearch, Graphite, and more. Grafana makes it easy to create dashboards with drilling down ca
Grafana: Open Source Analytics and Monitoring Visualization Tool
Grafana allows you to query, visualize, alert on and understand metrics from various data sources like Prometheus, Elasticsearch, Graphite, and more.
What is Grafana?
Grafana is a feature-rich, open source analytics and monitoring visualization suite. It integrates tightly with a variety of database technologies like Graphite, Prometheus, InfluxDB, Elasticsearch, and more to allow for easy exploration and visualization of time series data.
Some key capabilities and benefits of Grafana include:
Intuitive graphical UI makes it easy for non-technical users to create dashboards
Drill down capabilities allow users to dig deeper into metrics and narrow in on issues
Annotations provide a way to mark key events on graphs and dashboards
Customizable alert notifications help quickly identify and troubleshoot problems
Visualizations can be shared with non-Grafana users easily
Hundreds of data source plugins available to connect just about any time series database
An active open source community contributes plugins and dashboards
Grafana is commonly used for infrastructure and application monitoring, Internet of Things data visualization, business analytics, and more. Its emphasis on being visual, flexible and easy-to-use makes Grafana a popular choice for organizations wanting deeper insight into their data and systems.
Grafana is incredibly powerful for visualizing metrics and building dashboards, especially with its wide data source support. However, the initial setup and custom panel configuration can be frustratingly complex for new users. While the dashboards look great once built, I've …
Grafana is incredibly powerful for visualizing metrics from multiple sources, and once set up, the dashboards look fantastic and are easy to share. However, the initial configuration, especially connecting complex data sources and writing queries, can be very intimidating for …
Incredibly Powerful and Flexible Visualization Tool
We've been using Grafana for monitoring our application's performance and infrastructure health, and it has been a game-changer. The ability to pull data from multiple sources like Prometheus and Elasticsearch into one cohesive dashboard is invaluable. Creating dashboards is fairly …
Grafana has become indispensable for our DevOps team. We use it daily to visualize metrics from Prometheus and Elasticsearch, creating intuitive dashboards that help us spot issues quickly. I particularly appreciate how easy it is to share live dashboards with …
While Grafana is incredibly powerful for visualizing metrics, the learning curve is incredibly steep. The UI feels cluttered and unintuitive, especially when trying to set up complex dashboards. I've also experienced random dashboard crashes that lose my work, and the …
Datadog is a SaaS-based monitoring and analytics platform for cloud applications. It provides complete visibility into dynamic infrastructures by aggregating metrics, events, and logs from servers, containers, databases, tools, and services. This allows Dev and Ops teams to quickly solve performance problems, prove the root cause of software bugs, spot...
What Is OpenSearch?OpenSearch is an open-source search and analytics engine forked from Elasticsearch 7.10 by Amazon Web Services. It provides full-text search, log analytics, application monitoring, and data visualization capabilities.Key FeaturesOpenSearch supports full-text search with relevance scoring, aggregations for analytics, and near-real-time indexing. It includes OpenSearch Dashboards (forked from Kibana)...
Splunk is a software platform that enables users to search, analyze, and visualize the data gathered from the infrastructure, systems, and applications of an organization. It captures, indexes, and correlates real-time data in a searchable repository from which it can generate graphs, reports, alerts, dashboards, and visualizations.Some key features and...
New Relic is a comprehensive application performance monitoring and observability platform used by software engineers to monitor, troubleshoot, and optimize their applications and infrastructure. It provides real-time visibility into the performance, health, and usage of applications running in cloud, hybrid, and on-premises environments.Key features of New Relic include:Application monitoring -...
Kibana is an open source analytics and visualization platform designed to operate on top of Elasticsearch. Kibana provides search and data visualization capabilities for data indexed in Elasticsearch clusters. Some of the key capabilities and features of Kibana include:Interactive dashboards - Kibana allows users to create rich, interactive dashboards and...
logz.io is a cloud-native log management and analytics platform designed for modern cloud-based architectures. It offers the following key capabilities:Real-time log analysis - logz.io ingests and indexes log data from any source in real-time, allowing you to search and analyze log data on-the-fly.Intelligent alerting - Configure advanced correlation rules to...
Tableau is a leading business intelligence and data visualization platform used by organizations of all sizes to transform their data into easy-to-understand visualizations and dashboards. With Tableau, users can connect to a wide range of data sources, prepare and clean the data for analysis, and create interactive data visualizations such...
Metabase is an open source business intelligence platform and analytics tool. It allows anyone on a team to ask questions about their data, explore it, and share insights with others through easy-to-create dashboards, charts, and visualizations. Metabase provides an intuitive frontend interface so users can get answers and discover trends...
Wazuh is an open source security monitoring solution built on top of OSSEC. It provides threat detection, compliance, and data protection capabilities. Some of the key features of Wazuh include:Log analysis - Analyzes logs from applications, operating systems, and devices to detect suspicious activity, intrusions, policy violations etc.File integrity monitoring...
Loggly is a scalable log management and analytics platform designed for modern cloud-based applications and infrastructure. It allows developers, DevOps engineers, and IT operations teams to easily aggregate log data from servers, networks, applications, containers, and cloud services into a centralized cloud repository.Key capabilities and benefits of Loggly include:Real-time log...
Logsniffer is a useful open source web log analyzer software that helps website owners, developers and administrators visualize and monitor traffic coming to their sites. It works by processing standard web server log files like Apache and Nginx access logs and transforming the data into insightful statistics and charts.Some key...
Nagios Log Server is an open-source solution for log monitoring, analysis and alerting. It is designed to address the growing need for centralized log data and event monitoring in IT environments.Key features and capabilities include:Real-time log data aggregation from multiple sources like files, databases, network devices and morePowerful searching and...
Snapboard is an online visual collaboration software used by teams for brainstorming, organizing workflows, managing projects, and more. It provides an infinite virtual whiteboard where users can add sticky notes, images, freehand drawings, and diagrams to capture ideas and map out plans.Key features of Snapboard include:Infinite canvas for adding unlimited...
NIXStats is an open-source web analytics application that allows website owners to track and analyze traffic to their sites. It provides detailed statistics on visits, unique visitors, page views, bounce rates, traffic sources, and more. As an open-source platform, NIXStats places no restrictions on data collection or analysis and avoids...
Cyclotron is an open-source task management and productivity application for Windows, macOS, and Linux operating systems. It provides users with a flexible framework to organize individual tasks as well as larger projects.Key features of Cyclotron include:Custom categories, tags, milestones, and workflows to categorize tasks and structure projectsCalendar and reminder system...
Freeboard is an open-source business intelligence and data visualization software. It provides an intuitive drag-and-drop interface that allows users to visualize data from multiple sources, without needing to code. Some key features of Freeboard include:Connectivity to a variety of data sources like SQL databases, REST APIs, MQTT, and moreLibrary of...
Papertrail is a cloud-based log management and analysis platform designed for infrastructure monitoring, application troubleshooting, and compliance reporting. It aggregates log data in real-time from servers, clouds, containers, and applications into a centralized, searchable web archive.Key features of Papertrail include:Real-time log streaming - Logs are streamed to Papertrail in real-time...
Redash is an open-source business intelligence and data visualization web application. It allows users to connect to multiple data sources including SQL databases, query and visualize the data, and create interactive dashboards to share insights.Some key features of Redash:Connect to data sources like PostgreSQL, MySQL, SQL Server, Redshift, BigQuery and...
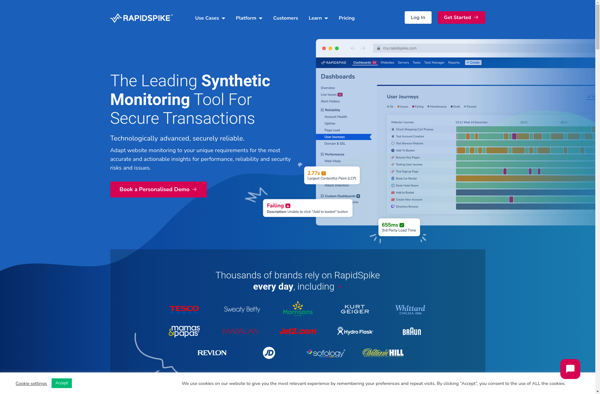
RapidSpike is a powerful yet easy-to-use load and performance testing tool designed for testing the performance of web applications. It provides the ability to simulate hundreds or thousands of concurrent virtual users to generate realistic workloads on web apps to identify performance bottlenecks and ensure applications can handle expected traffic.Key...
DashThis is a user-friendly project management and task tracking application designed for small teams and businesses. It provides an intuitive interface to plan projects, create tasks, set due dates, assign work to team members, track progress, and collaborate with others.Some key features of DashThis include:Flexible project views - See all...
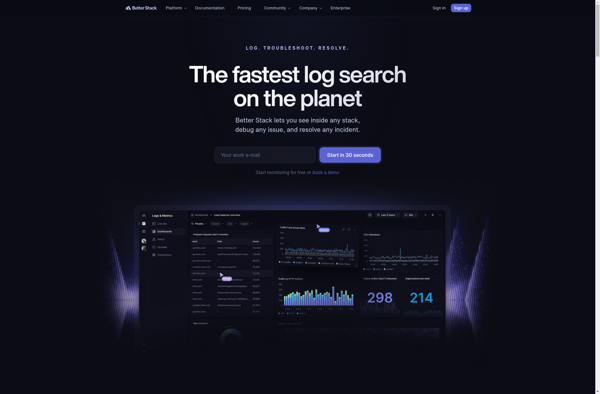
Better Stack Logs is a robust logging and monitoring platform designed for software developers and IT operations teams. It aggregates application and system logs from multiple sources across an infrastructure into a unified dashboard with powerful search and filtering capabilities.Key features include:Collect logs from virtually any source - applications, databases,...
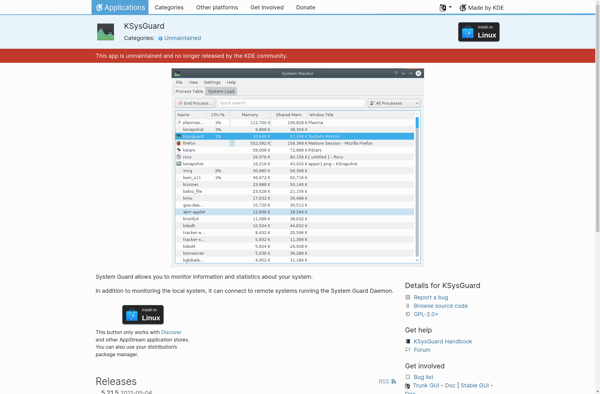
KSysGuard is a feature-rich system monitor and process manager application designed for the KDE desktop environment on Linux. It provides detailed insight into various aspects of system resource usage and running processes.Some of the key features of KSysGuard include:Real-time graphs and statistics for CPU, memory, swap, network, file system, and...
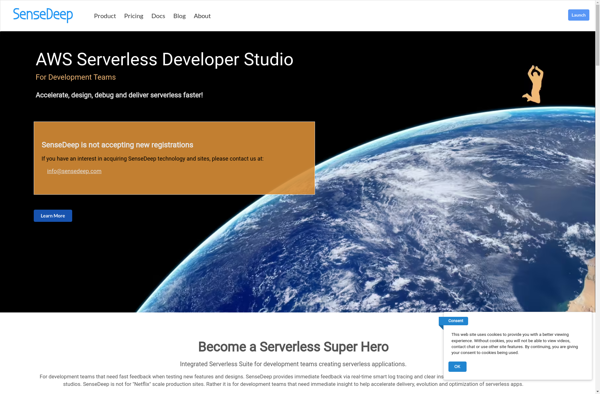
SenseLogs is a user research and feedback platform designed to help product teams better understand user needs and pain points. The software provides an end-to-end solution for planning, conducting, and analyzing qualitative user research.Key features of SenseLogs include:Recruiting - Integrates with panel providers to recruit target users that match your...
Logentries is a cloud-based log management service that provides log aggregation, real-time log analysis and visualization, intelligent alerting, and log archive search. Some key features include:Real-time streaming of log data from servers, cloud platforms, networks, web apps, mobile apps etc.Powerful analytics to visualize trends, statistics, frequences etc. in your log...
Sawmill is a powerful log analysis and reporting platform for IT administrators and developers. It collects log data from multiple sources across your infrastructure and applies intelligent parsing to extract meaningful information.With customizable dashboards and reports, Sawmill gives you visibility into application usage, user behavior, security threats, and more. Some...
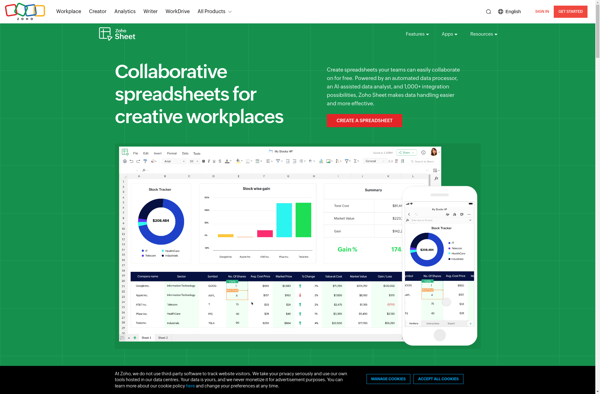
Zoho Sheet is an online spreadsheet software application developed by Zoho Corporation. It is part of the Zoho Office Suite which includes other office productivity tools like a word processor, presentation software, and more.As an online spreadsheet software, Zoho Sheet provides core spreadsheet functionality like calculations, pivot tables, charts, and...
Chartbrew is an open-source business intelligence and data visualization platform used to analyze data and create interactive charts, graphs, and dashboards. It has an easy-to-use drag and drop interface that allows users to connect to SQL, NoSQL, CSV data sources, and SaaS applications to visualize data and find insights.Some key...
Knowi is a business intelligence and analytics software that provides tools for data visualization, reporting, and dashboard creation. It allows non-technical users to easily access, analyze, and visualize data without needing to know SQL or coding.Some key features of Knowi include:Drag-and-drop interface to build interactive dashboards, charts, reports and visualizationsBroad...
Timber is an open source WordPress plugin created by Upstatement that allows developers to build WordPress themes using the Twig PHP templating engine. It serves as a templating framework that integrates Twig into WordPress themes for a cleaner, more sustainable code base.Some of the key benefits of using Timber for...
Scalyr is a log management and observability platform designed for monitoring, troubleshooting, and securing cloud-native infrastructure and applications. Key capabilities and features include:Real-time log, metric, and event collection from servers, containers, services, and applicationsPowerful search and filtering for rapid troubleshooting and forensic analysisCustomizable dashboards and alerts for proactive monitoringAutomatic parsing...
CloudMonix is a comprehensive cloud management platform designed to provide visibility, governance, and automation across public, private, and hybrid cloud environments. Here are some key capabilities of CloudMonix:Multi-cloud monitoring and management - Discover workloads across AWS, Azure, GCP and Kubernetes and gain unified visibility into resource utilization, performance, cost, security,...
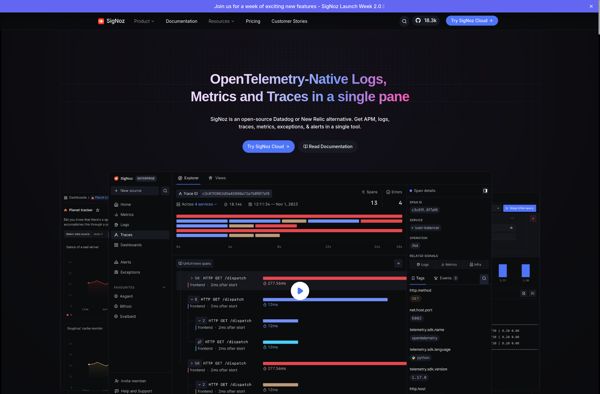
SigNoz is an open-source alternative to commercial Application Performance Monitoring (APM) tools like DataDog, New Relic, and Dynatrace. It is a cloud-native observability platform designed specifically for monitoring modern distributed systems.Some key capabilities and benefits of SigNoz include:Lightweight and optimized for microservices, serverless, and Kubernetes environmentsCollects metrics, traces, and logs...
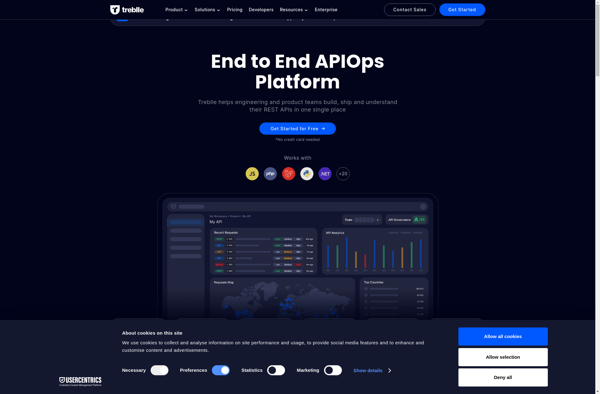
Treblle is an API analytics and debugging platform designed specifically for developers and engineering teams. It allows you to easily monitor, troubleshoot, and optimize your APIs.Some key features and benefits of Treblle:Automatic API monitoring - Treblle automatically detects and starts monitoring your API traffic out of the box without complex...
Marple is an open-source, Markdown-based slide deck tool for creating presentations. It provides a minimalistic editor interface to write slide content in Markdown format, which then gets rendered into an elegant slide deck for presenting.Some key features of Marple:Write slide content in easy-to-read and write Markdown format. Format headings, lists,...
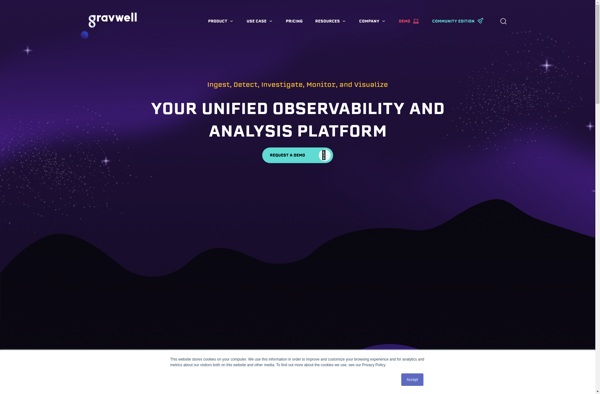
Gravwell is an open source log analytics and security monitoring platform designed specifically for high-performance log collection, indexing, and search across massive datasets. It ingests logs, network traffic, and other machine-generated data at very high speeds and provides real-time search and analytics capabilities.Some key features and capabilities of Gravwell include:Real-time...
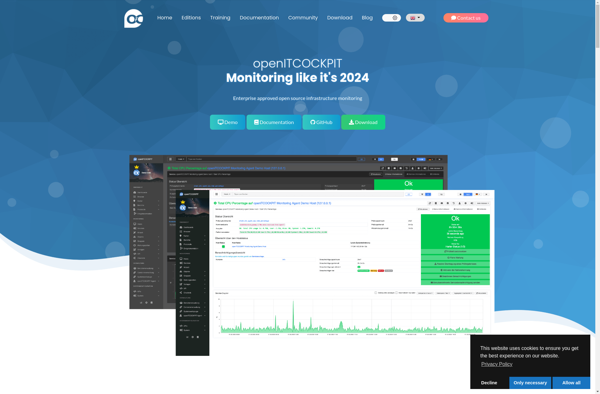
openITCOCKPIT is an open source, web-based IT management and monitoring platform. It provides monitoring capabilities for networks, servers, applications, services, virtual environments and more. Some key features include:Intuitive dashboard for viewing system statusMonitoring modules for Linux, Windows, SNMP, VMware, Docker and moreCustomizable alerts and notifications via email, Slack, Telegram etc.Visual...
LogLogic is a comprehensive log management and analytics platform designed for enterprises. It collects and aggregates log data from across an organization's entire IT infrastructure including servers, networks, security devices, operating systems and applications. Key capabilities of LogLogic include:Real-time log monitoring and analysis to detect anomalies and threatsInteractive search across...
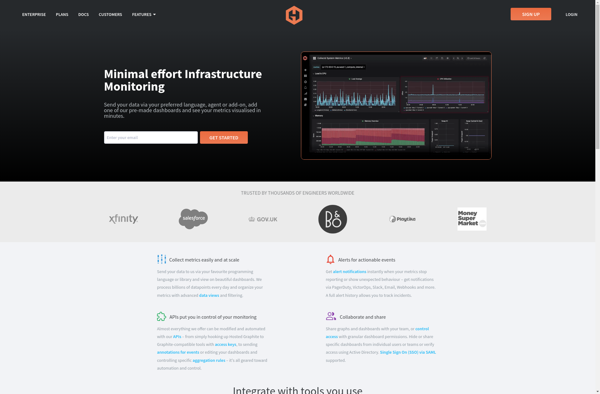
Hosted Graphite is a Software-as-a-Service platform that provides cloud-based monitoring and observability for applications and infrastructure. It specializes in analyzing time-series data such as metrics, logs, and events to provide insights into performance, availability, and usage trends.Key features of Hosted Graphite include:Customizable dashboards for visualizing metrics and building graphsAlerting based...
Logscape is a log management and analytics platform designed to help IT teams aggregate, analyze, and visualize machine data from across their infrastructure and applications. Some key capabilities and benefits of Logscape include:Real-time log aggregation from physical servers, virtual machines, cloud platforms, containers, network devices, and more using lightweight agentsOut-of-the-box...
CloudPelican is a innovative cloud-based document management and file sharing service designed to help teams collaborate and share files easily and securely. Here are some key capabilities of CloudPelican:Cloud-based storage - Store all your business documents, images, videos and more in the cloud. Access them from anywhere on any device.File...
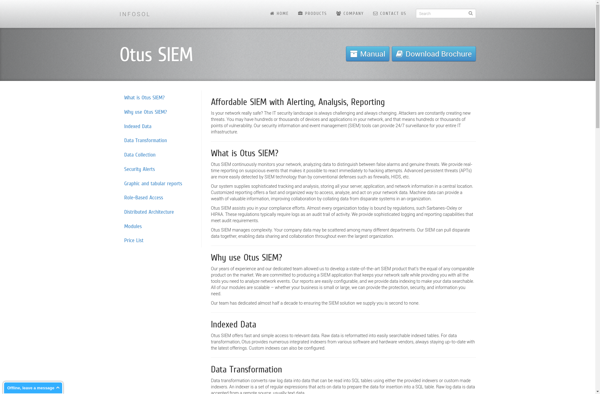
OTUS SIEM is a security information and event management platform purpose-built for enterprises that need to manage IT infrastructure at scale. It collects log and event data from across an organization's networks, endpoints, cloud services, and other systems.Powerful analytics help OTUS SIEM detect advanced threats and zero-day attacks while providing...
XpoLog is a comprehensive cloud-based logistics management software designed for shippers, third-party logistics providers (3PLs), freight brokers, and carriers. It features robust transportation management, warehouse management, order management, and inventory management tools to help streamline operations.Key capabilities and benefits of XpoLog include:Transportation management - automates planning, execution, tracking, and settlement...
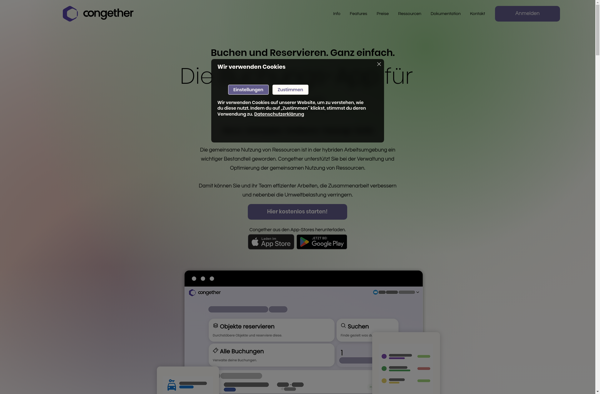
Congether is a free, open-source, self-hosted video conferencing software designed for teams who want greater control and privacy over their online meetings. It allows users to conduct meetings, webinars, conference calls with features like screen sharing, chat, polling and recording options.Some of the key features of Congether include:Works across platforms...
HostedMetrics is a user-friendly web analytics platform designed for businesses who want powerful yet intuitive analytics. As a hosted solution, there is no software to install or servers to maintain. HostedMetrics seamlessly integrates with your website to track every visitor interaction, then transforms that raw data into beautifully visualized reports...
RST Cloud is a cloud-based document creation, collaboration, and publishing platform used by organizations to streamline the creation and distribution of business documents. It provides real-time co-authoring capabilities so multiple people can work on documents simultaneously from any device.Key features of RST Cloud include:Intuitive WYSIWYG editor for creating professional, branded...
IQLECT is an e-learning software used to create interactive online courses and training programs. It provides a suite of tools that enable teachers, professors, corporate trainers and instructional designers to author rich and engaging learning content.Key features of IQLECT include:Intuitive course authoring tools to build interactive lessons, assessments, simulations, scenarios...
DalmatinerDB is an open-source, high-performance metrics database and time-series database (TSDB) written in Erlang. It is designed to collect, store and query large volumes of time-series data with millisecond precision.Some key features and benefits of DalmatinerDB include:Fast writes - Optimized to handle high velocity data with minimal latency. Can handle...
Monique.io is an open-source web analytics platform built with privacy in mind. It aims to provide website owners useful analytics and insights without compromising visitor privacy.Unlike Google Analytics, Monique.io collects only essential and anonymous analytics data. It does not use cookies or unique identifiers to track users across websites. The...
Log Collector is a log management and analysis software that helps organizations aggregate log data from across their IT infrastructure into a centralized repository. It collects log data from servers, network devices, applications, cloud platforms, and more using built-in integrations or APIs.Once the log data is aggregated, Log Collector provides...