Knowi vs Grafana

Struggling to choose between Knowi and Grafana? Both products offer unique advantages, making it a tough decision.

Knowi is a Business & Commerce solution with tags like data-visualization, dashboards, draganddrop, nocode.

It boasts features such as Drag-and-drop interface to build dashboards, Pre-built templates and visualizations, Real-time data connectivity, Collaboration tools to share dashboards, Mobile optimization and alerts, Natural language query, Embedded analytics and pros including Intuitive and easy to use, Great for non-technical users, Fast deployment, Scales to large data sets, Integrates well with multiple data sources, Strong visualization capabilities.

On the other hand, Grafana is a Ai Tools & Services product tagged with analytics, monitoring, visualization, dashboard.

Its standout features include Visualization of time series data, Support for multiple data sources, Annotation and alerting capabilities, Dashboard creation and sharing, Plugin ecosystem for extensibility, and it shines with pros like Open source and free, Powerful and flexible visualization, Wide range of data source integrations, Active community support.

To help you make an informed decision, we've compiled a comprehensive comparison of these two products, delving into their features, pros, cons, pricing, and more. Get ready to explore the nuances that set them apart and determine which one is the perfect fit for your requirements.

Knowi

Knowi

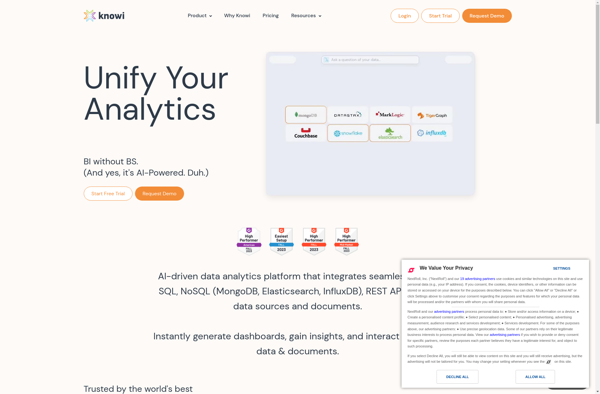
Knowi is a business intelligence and analytics platform that allows users to easily visualize data and create interactive dashboards. It has drag-and-drop functionality to build reports and charts without coding.

Categories:
data-visualization dashboards draganddrop nocode

Knowi Features

  1. Drag-and-drop interface to build dashboards
  2. Pre-built templates and visualizations
  3. Real-time data connectivity
  4. Collaboration tools to share dashboards
  5. Mobile optimization and alerts
  6. Natural language query
  7. Embedded analytics

Pricing

  • Subscription-Based

Pros

Intuitive and easy to use

Great for non-technical users

Fast deployment

Scales to large data sets

Integrates well with multiple data sources

Strong visualization capabilities

Cons

Limited customization compared to open-source BI tools

Not as feature rich as some competitors

Can be pricey for larger deployments

Steep learning curve for advanced analysis

Relies heavily on pre-built templates


Grafana

Grafana

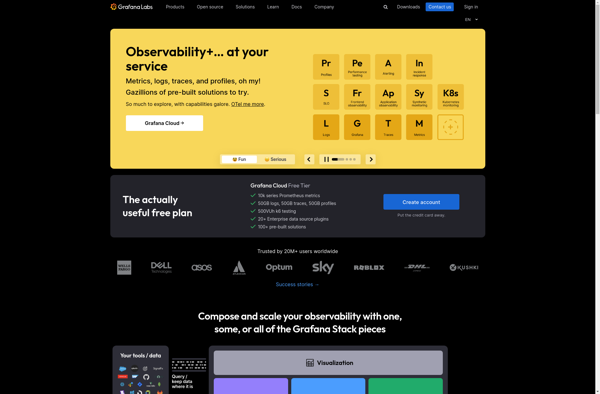
Grafana is an open source analytics and monitoring visualization tool. It allows you to query, visualize, alert on and understand metrics from various data sources like Prometheus, Elasticsearch, Graphite, and more. Grafana makes it easy to create dashboards with drilling down capabilities as well as share visualizations with non-technical team members.

Categories:
analytics monitoring visualization dashboard

Grafana Features

  1. Visualization of time series data
  2. Support for multiple data sources
  3. Annotation and alerting capabilities
  4. Dashboard creation and sharing
  5. Plugin ecosystem for extensibility

Pricing

  • Open Source
  • Free
  • Enterprise Subscription

Pros

Open source and free

Powerful and flexible visualization

Wide range of data source integrations

Active community support

Cons

Steep learning curve

Setting up data sources can be tricky

Limited built-in alerting capabilities