Knowi
Knowi is a business intelligence and analytics platform that allows users to easily visualize data and create interactive dashboards. It has drag-and-drop functionality to build reports and charts without coding.
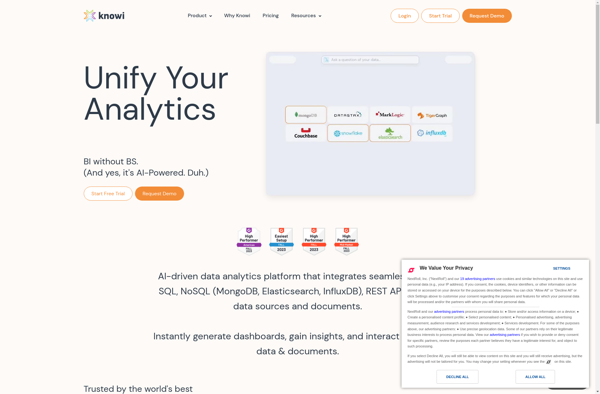
Knowi: Business Intelligence & Analytics Platform
A business intelligence platform allowing users to visualize data, create interactive dashboards, and build reports with drag-and-drop functionality without coding.
What is Knowi?
Knowi is a business intelligence and analytics software that provides tools for data visualization, reporting, and dashboard creation. It allows non-technical users to easily access, analyze, and visualize data without needing to know SQL or coding.
Some key features of Knowi include:
- Drag-and-drop interface to build interactive dashboards, charts, reports and visualizations
- Broad connectivity to data sources like SQL, NoSQL, cloud apps, etc.
- Smart natural language search to instantly get insights from data
- Pre-built templates and widgets for common visualizations
- Collaboration tools to share dashboards and insights across the organization
- Scheduled and real-time data refresh to always see up-to-date metrics
- Robust self-service analytics capabilities for business users without IT help
- Rich customization options for experienced analysts and power users
- Mobile optimization to view and interact with dashboards on any device
Overall, Knowi makes it easy for companies to democratize data access and promote a culture of data-driven decision making.
Knowi Features
Features
- Drag-and-drop interface to build dashboards
- Pre-built templates and visualizations
- Real-time data connectivity
- Collaboration tools to share dashboards
- Mobile optimization and alerts
- Natural language query
- Embedded analytics
Pricing
- Subscription-Based
Pros
Intuitive and easy to use
Great for non-technical users
Fast deployment
Scales to large data sets
Integrates well with multiple data sources
Strong visualization capabilities
Cons
Limited customization compared to open-source BI tools
Not as feature rich as some competitors
Can be pricey for larger deployments
Steep learning curve for advanced analysis
Relies heavily on pre-built templates
Official Links
Reviews & Ratings
Login to ReviewThe Best Knowi Alternatives
View all Knowi alternatives with detailed comparison →
Top Business & Commerce and Business Intelligence & Analytics and other similar apps like Knowi
Here are some alternatives to Knowi:
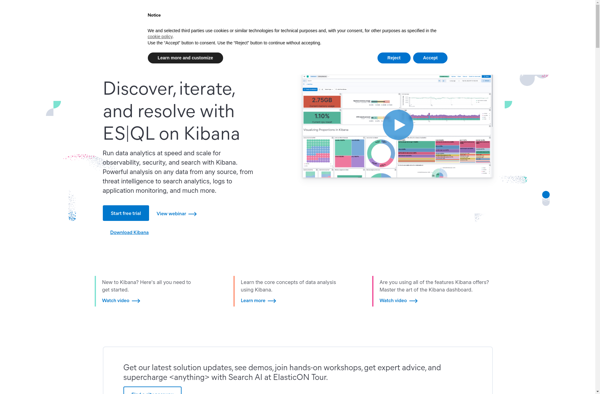
Suggest an alternative ❐Kibana
Kibana is an open source analytics and visualization platform designed to operate on top of Elasticsearch. Kibana provides search and data visualization capabilities for data indexed in Elasticsearch clusters. Some of the key capabilities and features of Kibana include:Interactive dashboards - Kibana allows users to create rich, interactive dashboards and...
Grafana
Grafana is a feature-rich, open source analytics and monitoring visualization suite. It integrates tightly with a variety of database technologies like Graphite, Prometheus, InfluxDB, Elasticsearch, and more to allow for easy exploration and visualization of time series data. Some key capabilities and benefits of Grafana include:Intuitive graphical UI makes it...

Microsoft Power BI
Microsoft Power BI is a powerful business analytics service developed by Microsoft. It empowers users to transform raw data into meaningful insights, create interactive reports and dashboards, and share data-driven stories within an organization. Power BI is designed to help businesses and individuals make informed decisions based on a comprehensive...

Tableau
Tableau is a leading business intelligence and data visualization platform used by organizations of all sizes to transform their data into easy-to-understand visualizations and dashboards. With Tableau, users can connect to a wide range of data sources, prepare and clean the data for analysis, and create interactive data visualizations such...

QlikView
QlikView is a business intelligence and data visualization platform used to create interactive dashboards and analytics applications. It was first released in 1993 by the Swedish company Qlik. Key features of QlikView include:Associative data modeling and in-memory analytics engine - Allows fast analysis of large, disparate datasets without predefined schema...

Pentaho
Pentaho is a comprehensive open source business intelligence (BI) suite that provides a range of data integration, analytics, visualization, reporting, data mining, and workflow capabilities. It is designed to help businesses consolidate data from disparate sources for unified analytics and reporting.Some of the key capabilities and components of Pentaho include:Data...

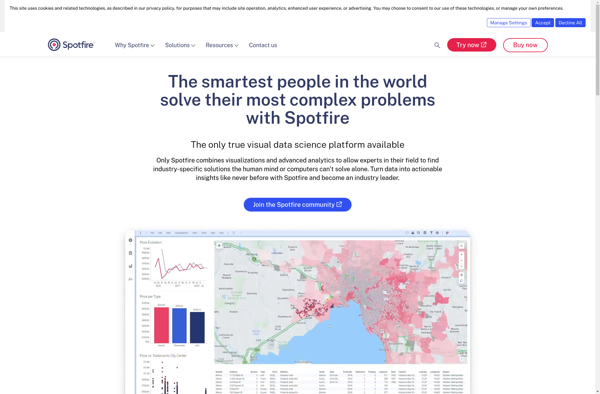
Spotfire
Spotfire is a business intelligence and analytics software platform designed for interactive data discovery and visualization. It enables rapid analysis of large, complex data sets to uncover deeper insights.Key features of Spotfire include:Interactive dashboards and visualizations - Drag-and-drop interface to create customized data visualizations like heat maps, charts, graphs, and...
Redash
Redash is an open-source business intelligence and data visualization web application. It allows users to connect to multiple data sources including SQL databases, query and visualize the data, and create interactive dashboards to share insights.Some key features of Redash:Connect to data sources like PostgreSQL, MySQL, SQL Server, Redshift, BigQuery and...

Sisense
Sisense is a business intelligence and data analytics software platform designed to help non-technical users prepare, analyze and visualize complex data. Some key features of Sisense include:Intuitive drag-and-drop interface for building interactive dashboards and visualizations like charts, graphs and pivot tables without coding.Ability to connect to wide variety of data...

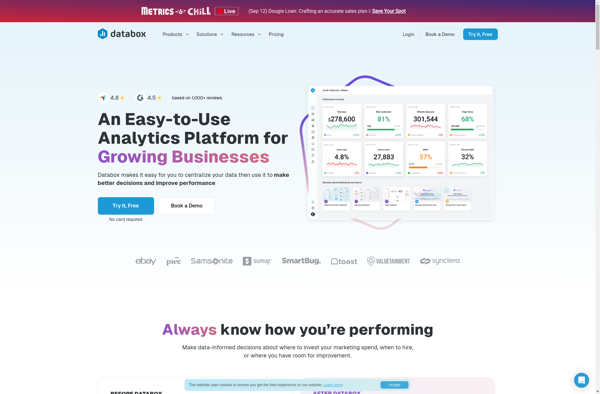
Databox
Databox is an open-source personal data platform that enables individuals to manage their personal data securely and privately. Developed by researchers at Imperial College London and the University of Cambridge, Databox allows users to connect data sources like smartphones, wearables, and web apps to feed data into the platform.Once data...
Datapine
Datapine is an easy-to-use business analytics and dashboard software designed to help businesses visualize, analyze and gain insights from their data. It provides powerful tools to access, clean, unify and model data from multiple sources, including SQL and NoSQL databases, cloud apps, spreadsheets, CSV files and more.Key features of Datapine...
Marple
Marple is an open-source, Markdown-based slide deck tool for creating presentations. It provides a minimalistic editor interface to write slide content in Markdown format, which then gets rendered into an elegant slide deck for presenting.Some key features of Marple:Write slide content in easy-to-read and write Markdown format. Format headings, lists,...
