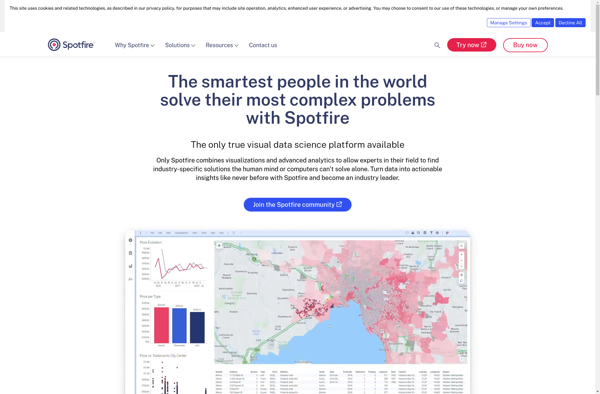
Spotfire is a business intelligence and analytics platform used for interactive data visualization and exploration. It provides capabilities for data wrangling, reporting, and predictive analytics.
Spotfire: Business Intelligence and Analytics Platform
Business intelligence and analytics platform for interactive data visualization and exploration, with data wrangling, reporting, and predictive analytics capabilities.
What is Spotfire?
Spotfire is a business intelligence and analytics software platform designed for interactive data discovery and visualization. It enables rapid analysis of large, complex data sets to uncover deeper insights.
Key features of Spotfire include:
Interactive dashboards and visualizations - Drag-and-drop interface to create customized data visualizations like heat maps, charts, graphs, and more.
Data wrangling tools - Built-in capabilities for joining, shaping, cleansing, and transforming data.
Predictive analytics - Incorporate predictive modeling and what-if analysis into dashboards and workflows.
Collaboration features - Annotations and shareable dashboards to promote insight sharing across the organization.
Scalability - Spotfire leverages in-memory and on-disk technologies to support fast analytics on datasets of any size.
Flexible deployment options - Available as a web-based client, desktop client, or server-based solution for enterprise deployment.
Target users for Spotfire include business analysts, data scientists, and other data-driven roles across industries like financial services, manufacturing, energy, pharmaceuticals, and more. It competes with solutions like Tableau, Qlik, Microsoft Power BI, and Tibco Jaspersoft.
Spotfire Features
Features
Interactive data visualization
Data discovery and exploration
Predictive analytics and machine learning
Collaboration tools
Automated reporting
Data wrangling and ETL
Connectivity to various data sources
Pricing
Subscription-Based
Pay-As-You-Go
Pros
Intuitive and interactive visualizations
Powerful data discovery capabilities
Scalability to large data sets
Integration with R and Python for advanced analytics
Collaboration features for sharing insights
Broad connectivity to data sources
Cons
Steep learning curve
Expensive licensing model
Limitations for handling streaming data
Less flexibility than coding analytics from scratch
Requires additional tools for production reporting
Microsoft Power BI is a powerful business analytics service developed by Microsoft. It empowers users to transform raw data into meaningful insights, create interactive reports and dashboards, and share data-driven stories within an organization. Power BI is designed to help businesses and individuals make informed decisions based on a comprehensive...
Tableau is a leading business intelligence and data visualization platform used by organizations of all sizes to transform their data into easy-to-understand visualizations and dashboards. With Tableau, users can connect to a wide range of data sources, prepare and clean the data for analysis, and create interactive data visualizations such...
QlikView is a business intelligence and data visualization platform used to create interactive dashboards and analytics applications. It was first released in 1993 by the Swedish company Qlik. Key features of QlikView include:Associative data modeling and in-memory analytics engine - Allows fast analysis of large, disparate datasets without predefined schema...
Redash is an open-source business intelligence and data visualization web application. It allows users to connect to multiple data sources including SQL databases, query and visualize the data, and create interactive dashboards to share insights.Some key features of Redash:Connect to data sources like PostgreSQL, MySQL, SQL Server, Redshift, BigQuery and...
Sisense is a business intelligence and data analytics software platform designed to help non-technical users prepare, analyze and visualize complex data. Some key features of Sisense include:Intuitive drag-and-drop interface for building interactive dashboards and visualizations like charts, graphs and pivot tables without coding.Ability to connect to wide variety of data...
DIVE (Data Insight Visualization Explorer) is an open source web application developed by researchers at the MIT Media Lab. It is designed to enable interactive exploration and visualization of complex, multi-faceted datasets.Some key features of DIVE include:Intuitive drag-and-drop interface for rapidly building visualizations like maps, charts, graphs, and moreSupport for...
Amazon QuickSight is a fast, cloud-powered business intelligence service that makes it easy to build visualizations, perform ad-hoc analysis, and quickly get business insights from your data. Some key features include:Intuitive visual interface that makes it easy to visualize and explore dataBroad data connectivity to connect to data sources like...
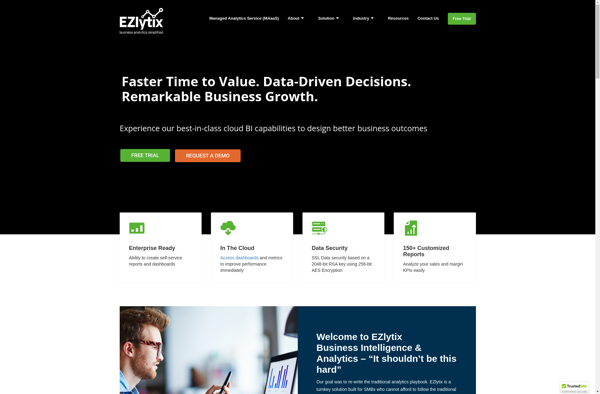
EZlytix is a business intelligence and data analytics software designed to help companies make data-driven decisions. It allows users to connect to various data sources, prepare and cleanse data, and create interactive dashboards and reports to gain insights.Some key features of EZlytix include:Intuitive drag-and-drop interface to build workflows, dashboards and...
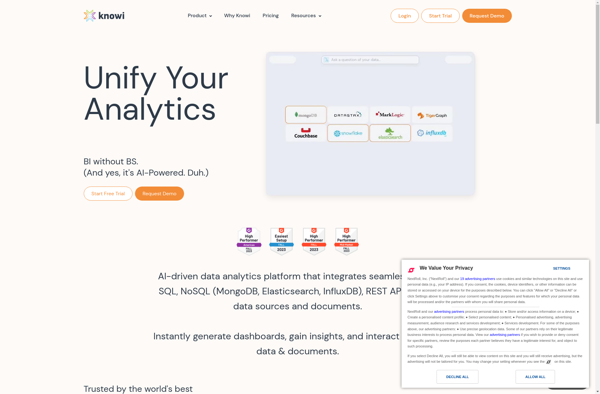
Knowi is a business intelligence and analytics software that provides tools for data visualization, reporting, and dashboard creation. It allows non-technical users to easily access, analyze, and visualize data without needing to know SQL or coding.Some key features of Knowi include:Drag-and-drop interface to build interactive dashboards, charts, reports and visualizationsBroad...
Marple is an open-source, Markdown-based slide deck tool for creating presentations. It provides a minimalistic editor interface to write slide content in Markdown format, which then gets rendered into an elegant slide deck for presenting.Some key features of Marple:Write slide content in easy-to-read and write Markdown format. Format headings, lists,...
InfoCaptor Dashboard is a business intelligence and analytics platform designed to help companies consolidate their data, create customized dashboards and reports, and uncover valuable insights. Some key features of InfoCaptor Dashboard include:Data connectivity and ETL - Connect to data from multiple sources like SQL and NoSQL databases, cloud apps, Excel,...
Dotmatics Vortex is a scientific informatics software platform used by pharmaceutical, biotechnology, and other research organizations to efficiently capture, store, analyze, and share chemical and biological data.Key features of Dotmatics Vortex include:Chemical registration system to store and search compounds and associated dataBio registration system to store and search biological entities...
Insights for ArcGIS is a powerful cloud-based location analytics solution by Esri for exploring, analyzing, and sharing spatial data through interactive data visualizations. As an all-in-one solution, Insights provides intuitive drag-and-drop tools that empower users of all skill levels to gain deeper insights into their data, identify patterns and trends,...
XLCubed is an Excel add-in designed specifically for financial analysts and modelers. It enhances Excel by providing commonly used financial functions, keyboard shortcuts, flexible graphing tools, and auditing features to improve model quality.Some of the key features of XLCubed include:Hundreds of financial and math functions like IRR, XNPV, XIRR, and...
miner3D is a free, open source cryptocurrency mining software for Windows, Linux and macOS. It supports major mining algorithms including Ethash, Equihash, CryptoNight and NeoScrypt, allowing users to mine popular cryptocurrencies like Ethereum, Zcash, Monero and Phoenixcoin.One of the key features of miner3D is its simple and easy-to-use graphical user...
Centius Qi is an intuitive, code-free business automation platform powered by artificial intelligence. It helps companies eliminate manual processes, automate repetitive tasks, and streamline workflows across the organization.With an easy-to-use drag and drop interface, Centius allows anyone to build workflows, set up integrations, create intelligent chatbots, gather actionable insights from...
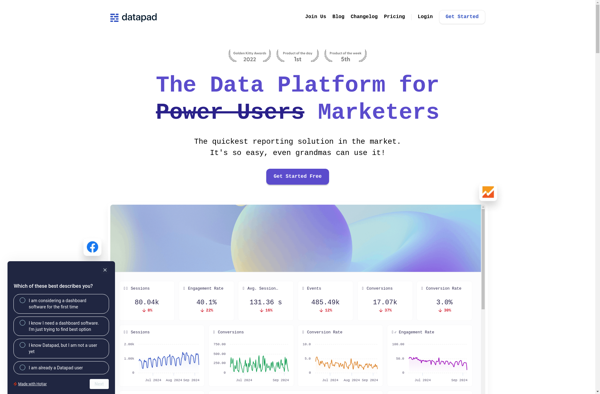
DataPad is a user-friendly data analysis and visualization software designed for researchers of all levels. With its intuitive drag-and-drop interface, DataPad allows users to easily import, clean, analyze and visualize complex datasets without coding.Key features include:Import data from CSV, Excel, databases and other sourcesInteractive drag-and-drop workflow to clean, analyze and...