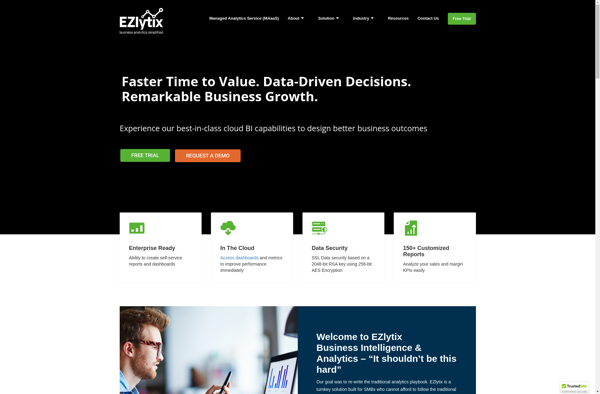
EZlytix is a business intelligence and data analytics platform that allows users to easily connect, prepare, and visualize data for insights. It has an intuitive drag-and-drop interface to build dashboards, reports, and workflows.
EZlytix: Business Intelligence & Data Analytics Platform
Connect, prepare, and visualize data for insights with EZlytix, a business intelligence platform featuring an intuitive drag-and-drop interface for building dashboards, reports, and workflows.
What is EZlytix?
EZlytix is a business intelligence and data analytics software designed to help companies make data-driven decisions. It allows users to connect to various data sources, prepare and cleanse data, and create interactive dashboards and reports to gain insights.
Some key features of EZlytix include:
Intuitive drag-and-drop interface to build workflows, dashboards and reports visually without coding
Broad connectivity to databases, cloud apps, files, etc. to access structured and unstructured data
Powerful ETL tools to blend, transform and enrich data from multiple sources
Machine learning-powered analytics for forecasting, predictions and recommendations
Collaboration tools to share reports and dashboards across the organization
Rich visualizations including charts, graphs, heat maps and more to represent data
Scheduling and automation capabilities for recurring workflows and reports
Role-based access control to manage users and permissions
APIs and integrations with other systems to embed analytics
EZlytix is suitable for small, medium and large enterprises looking for an end-to-end data analytics platform to turn raw data into meaningful insights. Its code-free environment allows business users to be self-sufficient while tackling complex data scenarios.
EZlytix Features
Features
Drag-and-drop interface for building dashboards, reports and workflows
Connects to various data sources like databases, cloud apps, files
Data preparation tools for cleaning, transforming and enriching data
Visualization library with charts, graphs and maps
Collaboration features like sharing dashboards and annotations
Microsoft Power BI is a powerful business analytics service developed by Microsoft. It empowers users to transform raw data into meaningful insights, create interactive reports and dashboards, and share data-driven stories within an organization. Power BI is designed to help businesses and individuals make informed decisions based on a comprehensive...
Tableau is a leading business intelligence and data visualization platform used by organizations of all sizes to transform their data into easy-to-understand visualizations and dashboards. With Tableau, users can connect to a wide range of data sources, prepare and clean the data for analysis, and create interactive data visualizations such...
QlikView is a business intelligence and data visualization platform used to create interactive dashboards and analytics applications. It was first released in 1993 by the Swedish company Qlik. Key features of QlikView include:Associative data modeling and in-memory analytics engine - Allows fast analysis of large, disparate datasets without predefined schema...
Pentaho is a comprehensive open source business intelligence (BI) suite that provides a range of data integration, analytics, visualization, reporting, data mining, and workflow capabilities. It is designed to help businesses consolidate data from disparate sources for unified analytics and reporting.Some of the key capabilities and components of Pentaho include:Data...
SAP BusinessObjects is a comprehensive business intelligence and analytics software suite from SAP. It brings together capabilities for reporting, analysis, dashboards, data visualization, data discovery, and more to help organizations unlock value from their data.Key capabilities and components of SAP BusinessObjects include:Centralized semantic layer for consistent data across the organizationPowerful...
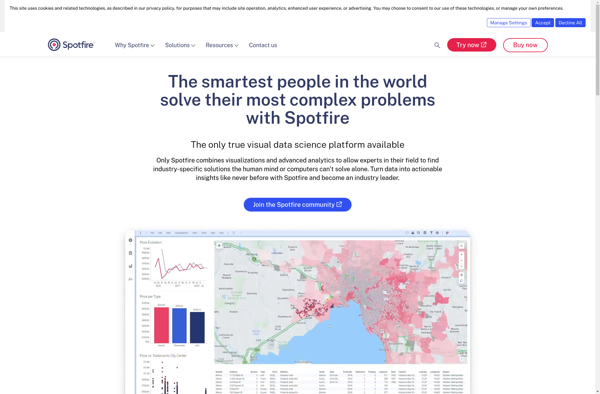
Spotfire is a business intelligence and analytics software platform designed for interactive data discovery and visualization. It enables rapid analysis of large, complex data sets to uncover deeper insights.Key features of Spotfire include:Interactive dashboards and visualizations - Drag-and-drop interface to create customized data visualizations like heat maps, charts, graphs, and...
Sisense is a business intelligence and data analytics software platform designed to help non-technical users prepare, analyze and visualize complex data. Some key features of Sisense include:Intuitive drag-and-drop interface for building interactive dashboards and visualizations like charts, graphs and pivot tables without coding.Ability to connect to wide variety of data...
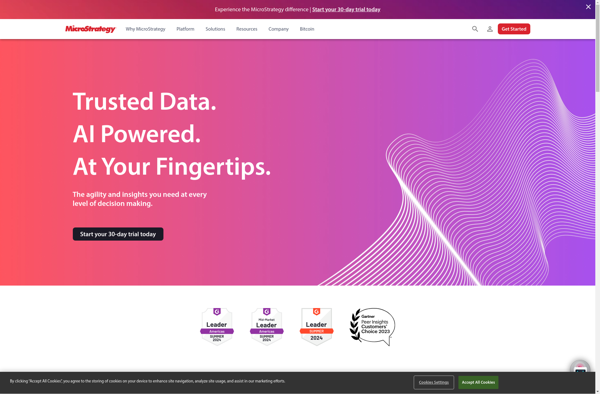
MicroStrategy is a leading enterprise analytics platform designed to help organizations make data-driven business decisions through advanced visualization and dashboarding capabilities. It serves as a one-stop solution for BI, allowing for data preparation, discovery, reporting, and predictive analytics.Key features of MicroStrategy include:Interactive dashboards and pixel-perfect reports that can be accessed...
Marple is an open-source, Markdown-based slide deck tool for creating presentations. It provides a minimalistic editor interface to write slide content in Markdown format, which then gets rendered into an elegant slide deck for presenting.Some key features of Marple:Write slide content in easy-to-read and write Markdown format. Format headings, lists,...
Birst is a cloud-native business intelligence and analytics platform used by enterprises to unify, understand, and act on data. Key capabilities and benefits include:Cloud data warehousing to bring together data from multiple sources for analysisInteractive dashboards and visualizations to spot trends and insightsSelf-service analytics empowering users across the organization to...
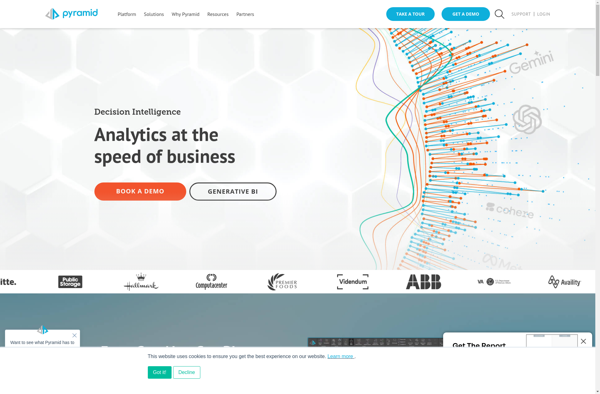
Pyramid Analytics is an advanced business intelligence and analytics platform designed to empower organizations to make faster, more informed decisions. It combines governed self-service analytics capabilities with artificial intelligence-powered features to enable employees to easily access, explore, and act on governed data.Key capabilities of Pyramid Analytics include:Unified governed self-service analytics...