MicroStrategy is a business intelligence software that allows organizations to analyze data and create visualizations to gain business insights. It offers data discovery, mobile analytics, pixel-perfect dashboards, and enterprise reporting capabilities.
MicroStrategy is a business intelligence software that allows organizations to analyze data and create visualizations to gain business insights. It offers data discovery, mobile analytics, pixel-perfect dashboards, and enterprise reporting capabilities.
What is MicroStrategy Business Intelligence?
MicroStrategy is a leading enterprise analytics platform designed to help organizations make data-driven business decisions through advanced visualization and dashboarding capabilities. It serves as a one-stop solution for BI, allowing for data preparation, discovery, reporting, and predictive analytics.
Key features of MicroStrategy include:
Interactive dashboards and pixel-perfect reports that can be accessed via web or mobile devices
Ad-hoc analysis and data discovery tools for business users to analyze data on their own
A semantic data layer that provides a unified view of enterprise data from multiple sources
Sophisticated visualization capabilities including heat maps, histograms, and scatter plots
Options for embedded or standalone analytics, as well as cloud deployment
Out-of-the-box connectors to extract, transform and load data from various sources and databases
Enterprise security features for user authentication, access controls and data encryption
With over 30 years in the market, MicroStrategy continues to innovate new capabilities in AI-driven analytics, HyperIntelligence augmented analytics, and zero-click analytics to serve the needs of modern data-driven organizations.
MicroStrategy Business Intelligence Features
Features
Data Discovery
Mobile Analytics
Pixel-Perfect Dashboards
Enterprise Reporting
Advanced Analytics
Predictive Modeling
Natural Language Processing
Embedded Analytics
Automated Insights
Pricing
Subscription-Based
Pros
Comprehensive business intelligence suite
Powerful data visualization and reporting capabilities
Mobile-friendly platform for on-the-go analytics
Scalable and enterprise-ready for large organizations
Customizable dashboards and reports
Advanced analytics and machine learning features
Cons
Steep learning curve for non-technical users
Relatively high cost compared to some competitors
Limited integration with certain data sources
Complexity can make it challenging to implement and maintain
Customization and deployment can be time-consuming
Microsoft Power BI is a powerful business analytics service developed by Microsoft. It empowers users to transform raw data into meaningful insights, create interactive reports and dashboards, and share data-driven stories within an organization. Power BI is designed to help businesses and individuals make informed decisions based on a comprehensive...
Tableau is a leading business intelligence and data visualization platform used by organizations of all sizes to transform their data into easy-to-understand visualizations and dashboards. With Tableau, users can connect to a wide range of data sources, prepare and clean the data for analysis, and create interactive data visualizations such...
JasperReports is an open source Java reporting library that can generate various types of reports from different data sources. It is very flexible and offers many features:Supports connecting to various data sources like SQL databases, NoSQL databases, XML, JSON, CSV files, etc.Can generate reports in multiple formats including PDF, HTML,...
Crystal Reports is a flexible business reporting tool used to design and generate professional reports from virtually any data source. Originally created by Crystal Services and now owned by SAP, Crystal Reports has been around since the early 1990s and has become one of the most popular reporting tools used...
SQL Server Reporting Services (SSRS) is a comprehensive enterprise reporting platform from Microsoft that allows users to create and deliver interactive, mobile-ready reports across the organization. SSRS can connect to almost any data source to build rich, interactive reports with charts, maps, sparklines and more.Key features and capabilities of SSRS...
Talend is an open source data integration and management platform designed to help organizations effectively collect, transform, cleanse and share data across systems and teams. Some key capabilities and benefits of Talend include:Graphical drag-and-drop interface to build data integration jobs and workflows without codingOver 900 pre-built data connectors to leading...
QlikView is a business intelligence and data visualization platform used to create interactive dashboards and analytics applications. It was first released in 1993 by the Swedish company Qlik. Key features of QlikView include:Associative data modeling and in-memory analytics engine - Allows fast analysis of large, disparate datasets without predefined schema...
PHP Report Maker is an open-source PHP library that allows generating PDF and Excel reports from various data sources including MySQL, PostgreSQL, MS SQL, SQLite, Oracle, and CSV files. It provides a simple API for custom report building and formatting using PHP, helping developers and businesses automate business reporting and...
Pentaho is a comprehensive open source business intelligence (BI) suite that provides a range of data integration, analytics, visualization, reporting, data mining, and workflow capabilities. It is designed to help businesses consolidate data from disparate sources for unified analytics and reporting.Some of the key capabilities and components of Pentaho include:Data...
Tableau Prep is a self-service data preparation application designed to empower users to quickly and easily combine, shape, and clean their data to speed up analytics. Key features include:Intuitive visual interface - Tableau Prep allows users to eliminate complex coding and scripting to prepare data through visual steps and drag-and-drop...
Jedox is a comprehensive business intelligence and corporate performance management platform designed for mid-size to large enterprises. It provides a wide range of capabilities including:Multi-dimensional online analytical processing (OLAP) for complex data analysis and modelingPlanning, budgeting, and forecasting features for financial planning and simulationCustomizable dashboards and self-service reporting for business...
EZlytix is a business intelligence and data analytics software designed to help companies make data-driven decisions. It allows users to connect to various data sources, prepare and cleanse data, and create interactive dashboards and reports to gain insights.Some key features of EZlytix include:Intuitive drag-and-drop interface to build workflows, dashboards and...
ReportServer is an open source business intelligence and reporting platform used to create and distribute interactive reports and dashboards. It supports connecting to various relational and NoSQL databases, flat files, REST APIs, and other data sources to build reports.Some key capabilities and benefits of ReportServer include:Ad-hoc reporting for business users...
Windward Core is a document generation and reporting engine that can be licensed and integrated into other applications that need advanced document creation and editing capabilities.It provides a full featured template design interface that allows users to easily create complex, data-powered documents without any programming. Templates can include text, images,...
FineReport is a business intelligence and reporting solution developed by FineReport Software Co., Ltd. It provides an intuitive drag-and-drop interface for report design, allowing users to easily create interactive and visually engaging reports, dashboards, and data visualizations.Some key features of FineReport include:Connectivity to a wide range of data sources like...
Marple is an open-source, Markdown-based slide deck tool for creating presentations. It provides a minimalistic editor interface to write slide content in Markdown format, which then gets rendered into an elegant slide deck for presenting.Some key features of Marple:Write slide content in easy-to-read and write Markdown format. Format headings, lists,...
Oracle OLAP is an online analytical processing (OLAP) technology developed by Oracle Corporation as part of the Oracle Database. It allows users to analyze data across multiple dimensions with complex hierarchies and calculations at very fast speeds.Some key features of Oracle OLAP include:Multidimensional data model to capture business metrics and...
Domino Data Lab is an end-to-end platform for data science teams to collaboratively build, deploy, and monitor analytical models. It brings together data science workloads across the model development lifecycle with integrated security, governance, and automation capabilities.Key capabilities and benefits of Domino Data Lab include:Centralized workspace for data science teams...
Platfora is a big data analytics software designed to help companies make sense of large and complex datasets. It provides an interactive visual interface that allows business users to analyze big data without needing to know how to code.Some key features of Platfora include:Intuitive visual workflows for exploring datasetsIn-memory processing...
XLCubed is an Excel add-in designed specifically for financial analysts and modelers. It enhances Excel by providing commonly used financial functions, keyboard shortcuts, flexible graphing tools, and auditing features to improve model quality.Some of the key features of XLCubed include:Hundreds of financial and math functions like IRR, XNPV, XIRR, and...
Sense Platform is an open-source business intelligence and analytics platform designed to make complex data stacks understandable and accessible to everyone across an organization. It provides a full range of tools for data integration, analysis, and visualization to help companies understand and extract valuable insights from their data.Some key capabilities...
Alpine Chorus is an audio plugin for Mac and Windows designed specifically for creating vocal harmonies and choruses. Some of the key features include:Up to 24 harmony voices, with control over chord type, inversion, and spreadAutomatic pitch correction and formant/voice shifting for natural sounding harmony vocalsBuilt-in reverb, delay, modulation, and...
SharpDevelop Reports is an open source report designer and generation tool for .NET applications. It provides a visual report builder that allows developers to easily create rich, customizable reports including charts, images, tables, and more without writing code.Some key features of SharpDevelop Reports:Drag and drop report designer for building reports...
Prognoz is a comprehensive business forecasting and predictive analytics platform designed to help organizations improve forecast accuracy and operational efficiency. It leverages sophisticated artificial intelligence algorithms, time series analysis, simulation modeling, and machine learning techniques to uncover patterns in historical data and generate accurate demand forecasts.Key features of Prognoz include:Intuitive...
Keboola Connection is a cloud-based data integration and transformation platform designed to help businesses efficiently manage their data pipelines and gain actionable insights. Some key features of Keboola Connection include:Drag-and-drop interface to visually build data workflows and ETL processes without codingPre-built connectors to easily integrate data from various sources like...
ProClarity is a business intelligence and analytics software designed to help organizations make data-driven decisions. It provides an interactive dashboard and data visualization capabilities to easily analyze large datasets from multiple sources.Key features of ProClarity include:Drag-and-drop interface to quickly build dashboards and visualizationsBroad connectivity to import data from SQL Server,...
KPI Watchdog is a robust business intelligence and data analytics platform designed to help companies track, analyze, and visualize key performance indicators (KPIs) in real-time. It provides powerful, customizable dashboards and reporting tools to monitor essential metrics across all departments and roles.With KPI Watchdog, businesses can connect data from multiple...
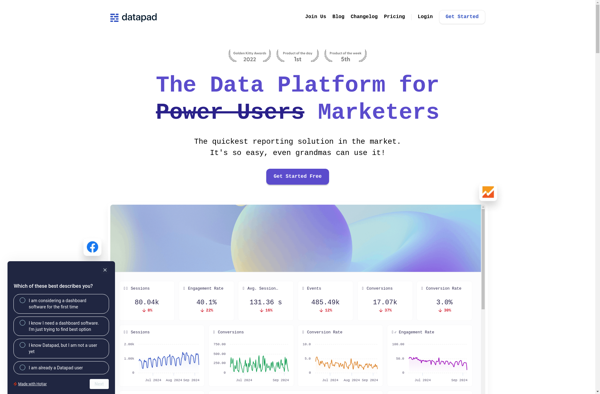
DataPad is a user-friendly data analysis and visualization software designed for researchers of all levels. With its intuitive drag-and-drop interface, DataPad allows users to easily import, clean, analyze and visualize complex datasets without coding.Key features include:Import data from CSV, Excel, databases and other sourcesInteractive drag-and-drop workflow to clean, analyze and...