Oracle OLAP icon

Oracle OLAP

Oracle OLAP is a multidimensional database analysis tool used for complex analytical queries, forecasting, budgeting, and data modeling. It allows fast queries across large datasets with complex calculations.

What is Oracle OLAP?

Oracle OLAP is an online analytical processing (OLAP) technology developed by Oracle Corporation as part of the Oracle Database. It allows users to analyze data across multiple dimensions with complex hierarchies and calculations at very fast speeds.

Some key features of Oracle OLAP include:

  • Multidimensional data model to capture business metrics and hierarchies
  • In-memory analytics engine for fast aggregation of data and calculations
  • Broad range of analytical functions like forecasting, allocation, and statistical modeling
  • Data mining capabilities to discover trends and patterns
  • Robust security to control data access
  • Integration with other Oracle tools like Oracle BI, Fusion Middleware, Database, and Applications

Oracle OLAP enables analysts to quickly gain insights from vast amounts of business data to inform better decision making. It can handle large data volumes, complex calculations, and response-time sensitive analytics applications like budgets, forecasts, allocations, sales analytics, profitability analysis, and more.

With its performance, scalability, and breadth of analytical capabilities, Oracle OLAP is well-suited for organizations looking to empower business users with timely, accurate analytics to drive growth and operational excellence.

The Best Oracle OLAP Alternatives

Top Apps like Oracle OLAP

SQL Server Reporting Services, Pentaho, Sisense, MicroStrategy Business Intelligence, Advanced Query Tool, Windward Core - Document Generation Component, GridGain In-Memory Data Fabric, Telerik Reporting, ProClarity, Nucleon BI Studio are some alternatives to Oracle OLAP.

SQL Server Reporting Services

SQL Server Reporting Services (SSRS) is a comprehensive enterprise reporting platform from Microsoft that allows users to create and deliver interactive, mobile-ready reports across the organization. SSRS can connect to almost any data source to build rich, interactive reports with charts, maps, sparklines and more.Key features and capabilities of...

Pentaho

Pentaho is a comprehensive open source business intelligence (BI) suite that provides a range of data integration, analytics, visualization, reporting, data mining, and workflow capabilities. It is designed to help businesses consolidate data from disparate sources for unified analytics and reporting.Some of the key capabilities and components of Pentaho...

Sisense

Sisense is a business intelligence and data analytics software platform designed to help non-technical users prepare, analyze and visualize complex data. Some key features of Sisense include:Intuitive drag-and-drop interface for building interactive dashboards and visualizations like charts, graphs and pivot tables without coding.Ability to connect to wide variety...

MicroStrategy Business Intelligence

MicroStrategy is a leading enterprise analytics platform designed to help organizations make data-driven business decisions through advanced visualization and dashboarding capabilities. It serves as a one-stop solution for BI, allowing for data preparation, discovery, reporting, and predictive analytics.Key features of MicroStrategy include:Interactive dashboards and pixel-perfect reports that can...

Advanced Query Tool

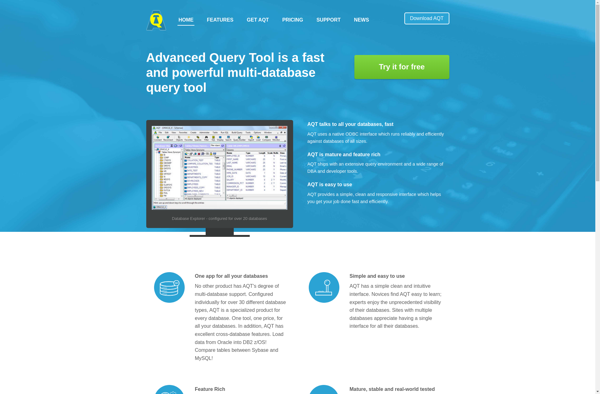
Advanced Query Tool (AQT) is an open-source, cross-platform data querying and reporting tool designed to simplify and speed up the process of connecting to databases, files, applications and services to visually build SQL queries and generate reports.With its easy-to-use graphical interface, AQT allows users to generate complex SQL queries...

Windward Core - Document Generation Component
Windward Core is a document generation and reporting engine that can be licensed and integrated into other applications that need advanced document creation and editing capabilities.It provides a full featured template design interface that allows users to easily create complex, data-powered documents without any programming. Templates can include text...

GridGain In-Memory Data Fabric

GridGain In-Memory Data Fabric is a distributed in-memory computing platform that enables organizations to develop data-intensive applications that require high performance and massive scalability. It provides an in-memory data grid that can be accessed by applications, allowing them to store and process data with in-memory speeds.Some key capabilities and...

Telerik Reporting

Telerik Reporting is a powerful report generation tool used to create richly formatted reports from a variety of data sources. It offers extensive report authoring capabilities including support for charts, maps, tables, shapes, images and more to build visually compelling and interactive reports.Some key features of Telerik Reporting include...

ProClarity

ProClarity is a business intelligence and analytics software designed to help organizations make data-driven decisions. It provides an interactive dashboard and data visualization capabilities to easily analyze large datasets from multiple sources.Key features of ProClarity include:Drag-and-drop interface to quickly build dashboards and visualizationsBroad connectivity to import data from...

Nucleon BI Studio

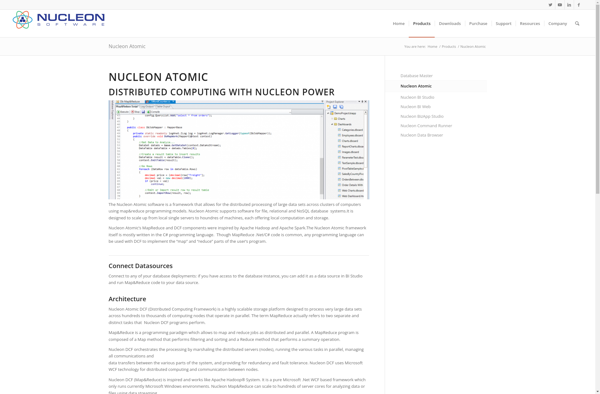
Nucleon BI Studio is a self-service business intelligence and analytics platform used by organizations to visualize, analyze, and share data insights. It provides an intuitive drag-and-drop interface that enables users without technical skills to easily build interactive dashboards, reports, and workflows to gain actionable insights from their data.Key capabilities...