Telerik Reporting is a report generation tool that allows users to create richly formatted reports from various data sources. It supports features like charts, maps, tables, shapes and more to build interactive reports.
Telerik Reporting is a report generation tool that allows users to create richly formatted reports from various data sources. It supports features like charts, maps, tables, shapes and more to build interactive reports.
What is Telerik Reporting?
Telerik Reporting is a powerful report generation tool used to create richly formatted reports from a variety of data sources. It offers extensive report authoring capabilities including support for charts, maps, tables, shapes, images and more to build visually compelling and interactive reports.
Some key features of Telerik Reporting include:
Connect to a wide variety of data sources - SQL Server, Oracle, OData, ObjectRelational, NoSQL, XML
Use wizards to easily create new reports from scratch or existing data
Drag-and-drop interface to build layouts with advanced data visualizations
Schedule and export reports to various formats like PDF, Excel, Word and more
Create dashboards and enable interactivity in reports through parameters, sorting, filtering, drill down
Seamless embed reports into .NET, Java or JavaScript applications
Leverage custom data processing, expressions, custom visualization extensions
Available via cloud, desktop, web and mobile deployment options
With its rich features for report authoring, visualization and distribution, Telerik Reporting provides a flexible platform to create and share insightful reports and better understand data.
Telerik Reporting Features
Features
Drag-and-drop report designer
Wide variety of data connectors
Support for popular formats like PDF, Excel, Word, HTML
Interactive reports with charts, maps, parameters
Schedule and subscribe to reports
REST API and .NET API for automation
Integration with popular platforms like ASP.NET, .NET Core, WPF
JasperReports is an open source Java reporting library that can generate various types of reports from different data sources. It is very flexible and offers many features:Supports connecting to various data sources like SQL databases, NoSQL databases, XML, JSON, CSV files, etc.Can generate reports in multiple formats including PDF, HTML,...
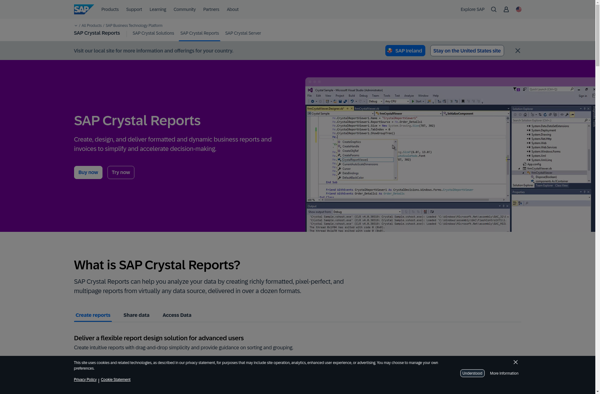
Crystal Reports is a flexible business reporting tool used to design and generate professional reports from virtually any data source. Originally created by Crystal Services and now owned by SAP, Crystal Reports has been around since the early 1990s and has become one of the most popular reporting tools used...
SQL Server Reporting Services (SSRS) is a comprehensive enterprise reporting platform from Microsoft that allows users to create and deliver interactive, mobile-ready reports across the organization. SSRS can connect to almost any data source to build rich, interactive reports with charts, maps, sparklines and more.Key features and capabilities of SSRS...
Pentaho is a comprehensive open source business intelligence (BI) suite that provides a range of data integration, analytics, visualization, reporting, data mining, and workflow capabilities. It is designed to help businesses consolidate data from disparate sources for unified analytics and reporting.Some of the key capabilities and components of Pentaho include:Data...
Stimulsoft Reports is a flexible business intelligence and reporting tool used to design and generate various types of reports. It provides an intuitive visual report designer for quickly building rich data visualizations and formatted reports.With Stimulsoft, you can connect to a wide variety of data sources including SQL databases, NoSQL...
ASP.NET Report Maker is an open-source reporting solution for ASP.NET web applications. It provides a drag-and-drop report designer for building rich data reports and dashboards that can be integrated seamlessly into ASP.NET projects.Key features include:Visual report designer for quick report buildingSupport for charts, tables, gauges, maps and other data visualizationsAbility...
FastReport Open Source is a popular open source reporting tool for .NET applications. It enables embedding full-featured reports into desktop, web and mobile applications to display and export data from various data sources into common formats like PDF, Word, Excel, CSV, text, and images.It is free to use and modify...
Valentina Reports is an open-source ad-hoc reporting tool that allows users to create rich visual reports and dashboards from various data sources including SQL & NoSQL databases, Excel, CSV files, Web APIs, and more. It has a graphical drag-and-drop report designer so users can build reports without coding.Key features include:Connectivity...
Colombian Report Designer is a comprehensive reporting solution used to design, manage, and distribute a wide variety of business reports. With its intuitive drag-and-drop interface, users can easily create polished, professional-looking reports without coding.Some key features include:Drag-and-drop report designer with a wide selection of charts, tables, images, and other visual...
Windward Core is a document generation and reporting engine that can be licensed and integrated into other applications that need advanced document creation and editing capabilities.It provides a full featured template design interface that allows users to easily create complex, data-powered documents without any programming. Templates can include text, images,...
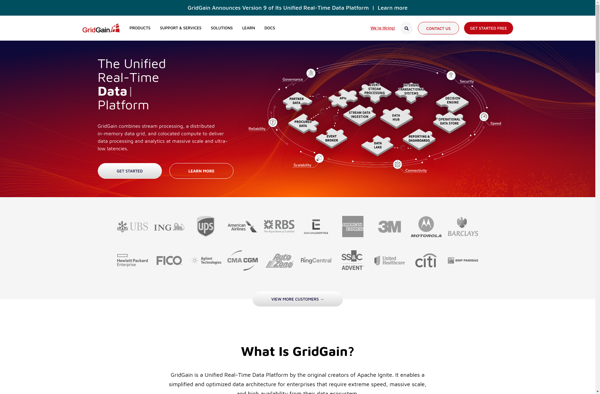
GridGain In-Memory Data Fabric is a distributed in-memory computing platform that enables organizations to develop data-intensive applications that require high performance and massive scalability. It provides an in-memory data grid that can be accessed by applications, allowing them to store and process data with in-memory speeds.Some key capabilities and benefits...
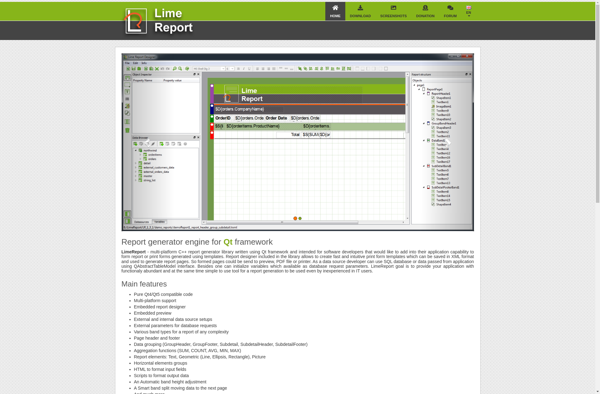
LimeReport is an open-source report generator and rendering engine that allows creating complex reports from various data sources. It is written in C++ and utilizes the Qt framework for the graphical user interface.Some key features and capabilities of LimeReport include:Visual report designer for drag & drop creation of report layouts...
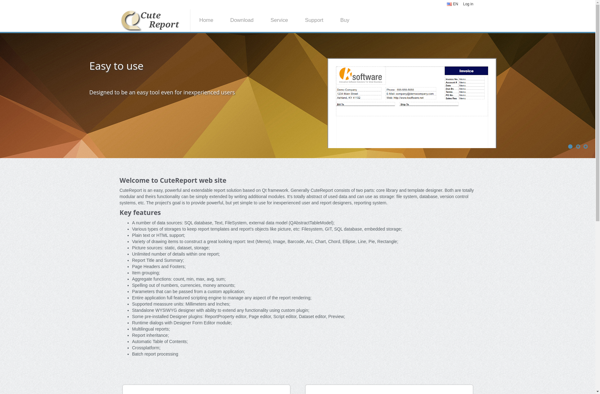
CuteReport is an open-source report creation system written in C++/Qt4. It enables developers to create any kind of reports and integrate them into their applications. The main advantages of CuteReport are:Visual report designer with drag and drop interfaceVarious kinds of diagrams and chartsSupport for multiple data sources: SQL queries, CSV...
Oracle OLAP is an online analytical processing (OLAP) technology developed by Oracle Corporation as part of the Oracle Database. It allows users to analyze data across multiple dimensions with complex hierarchies and calculations at very fast speeds.Some key features of Oracle OLAP include:Multidimensional data model to capture business metrics and...
LogiXML is a business intelligence and analytics software platform used by organizations to access, analyze, visualize and share data. It allows companies to create interactive dashboards, pixel-perfect reports, and compelling data visualizations that provide actionable insights.Some key features of LogiXML include:Drag-and-drop interface to build reports and dashboards quickly without codingBroad...
KoolReport is an open-source PHP reporting library for faster and easier data reporting. Key features include:Easy and intuitive report creation with minimal codeSupport for variety of data sources: SQL databases, CSV/Excel files, etc.Various chart types including Line, Bar, Pie, Table, Pivot Table, Gauge Chart etc.Interactive reports and dashboardsExport reports to...
icStorm is an open-source, self-hosted agile project management application designed for small development teams. It offers similar core functionality as IceScrum, allowing teams to plan and track software projects using agile methodologies like Scrum and kanban.Key features of icStorm include:Customizable kanban boards to visualize workflow and track progressBacklogs for capturing...
Aspose.Total for Reporting Services is a powerful suite of tools for working with Microsoft SQL Server Reporting Services. It includes several components:Aspose.Words for Reporting Services - Export reports to Word and other word processing formatsAspose.Cells for Reporting Services - Export reports to Excel formatsAspose.Slides for Reporting Services - Export reports...
SharpDevelop Reports is an open source report designer and generation tool for .NET applications. It provides a visual report builder that allows developers to easily create rich, customizable reports including charts, images, tables, and more without writing code.Some key features of SharpDevelop Reports:Drag and drop report designer for building reports...
Windward Solo is document generation and reporting software designed for small businesses and individuals. It provides an intuitive way for users to merge data from various sources such as SQL databases, Excel files, Salesforce, and more into Microsoft Word, Excel, PowerPoint documents to quickly create customized reports, invoices, forms, letters,...
SQLwallet is an open-source SQL database engine built with a focus on security, encryption, and privacy. Developed by a team of database experts and cryptographers, SQLwallet aims to make handling confidential user data easier for developers.Some key features of SQLwallet include:End-to-end encryption for data at rest and in transitFine-grained access...
Palo Alto Networks' Palo Suite is an integrated platform that delivers a broad range of cybersecurity capabilities for enterprises. It brings together network security, cloud security, advanced threat prevention, and more into a single offering.At the core of Palo Suite is the company's next-generation firewalls, which provide granular visibility and...
DrillDb is an open-source distributed SQL query engine for big data. It was originally developed by MapR and is now managed by the Apache Software Foundation. DrillDb allows users to analyze a variety of NoSQL databases and file systems without requiring them to structure the data upfront.Some key features and...