Valentina Reports is an open-source reporting tool that allows you to create rich visual reports and dashboards from various data sources. It has a graphical report designer to build reports without coding.
Create rich visual reports and dashboards with Valentina Reports, an open-source reporting tool that allows you to design reports without coding using its graphical report designer.
What is Valentina Reports?
Valentina Reports is an open-source ad-hoc reporting tool that allows users to create rich visual reports and dashboards from various data sources including SQL & NoSQL databases, Excel, CSV files, Web APIs, and more. It has a graphical drag-and-drop report designer so users can build reports without coding.
Key features include:
Connectivity to a wide variety of data sources
Interactive HTML5 pivot tables and dashboards
Charts and data visualizations
Built-in formulas and data transformation tools
Scheduling and report distribution
Mobile-friendly reports and dashboards
Role-based access control
Can be used as a standalone tool or integrated into Apps
It helps users gain business insights with its features for data analysis, reporting, and dashboarding. Valentina Reports is a cost-effective way for companies to add ad-hoc reporting and analytics to their Apps or internal systems without needing developers to build custom reports. Its open source nature also allows custom extensions and integrations.
JasperReports is an open source Java reporting library that can generate various types of reports from different data sources. It is very flexible and offers many features:Supports connecting to various data sources like SQL databases, NoSQL databases, XML, JSON, CSV files, etc.Can generate reports in multiple formats including PDF, HTML,...
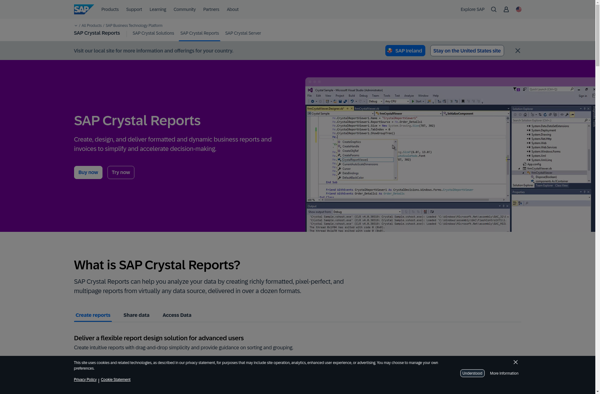
Crystal Reports is a flexible business reporting tool used to design and generate professional reports from virtually any data source. Originally created by Crystal Services and now owned by SAP, Crystal Reports has been around since the early 1990s and has become one of the most popular reporting tools used...
SQL Server Reporting Services (SSRS) is a comprehensive enterprise reporting platform from Microsoft that allows users to create and deliver interactive, mobile-ready reports across the organization. SSRS can connect to almost any data source to build rich, interactive reports with charts, maps, sparklines and more.Key features and capabilities of SSRS...
PHP Report Maker is an open-source PHP library that allows generating PDF and Excel reports from various data sources including MySQL, PostgreSQL, MS SQL, SQLite, Oracle, and CSV files. It provides a simple API for custom report building and formatting using PHP, helping developers and businesses automate business reporting and...
Pentaho is a comprehensive open source business intelligence (BI) suite that provides a range of data integration, analytics, visualization, reporting, data mining, and workflow capabilities. It is designed to help businesses consolidate data from disparate sources for unified analytics and reporting.Some of the key capabilities and components of Pentaho include:Data...
ASP.NET Report Maker is an open-source reporting solution for ASP.NET web applications. It provides a drag-and-drop report designer for building rich data reports and dashboards that can be integrated seamlessly into ASP.NET projects.Key features include:Visual report designer for quick report buildingSupport for charts, tables, gauges, maps and other data visualizationsAbility...
Sisense is a business intelligence and data analytics software platform designed to help non-technical users prepare, analyze and visualize complex data. Some key features of Sisense include:Intuitive drag-and-drop interface for building interactive dashboards and visualizations like charts, graphs and pivot tables without coding.Ability to connect to wide variety of data...
ART Reporting is a business intelligence and data visualization software used to create interactive reports and dashboards from company data. It provides an easy-to-use interface that allows non-technical users to build reports and visualize data without coding.With drag-and-drop functionality, users can quickly pull data from multiple sources, including SQL databases,...
DynamicReports is an open-source Java library for creating rich reports and dashboards. It provides a simple API for building complex layouts with tables, charts, images, and more without the need for specialized reporting tools.Some key features of DynamicReports:Runs on Java 8+ so integrates easily into Java web appsCreates PDF, Excel,...
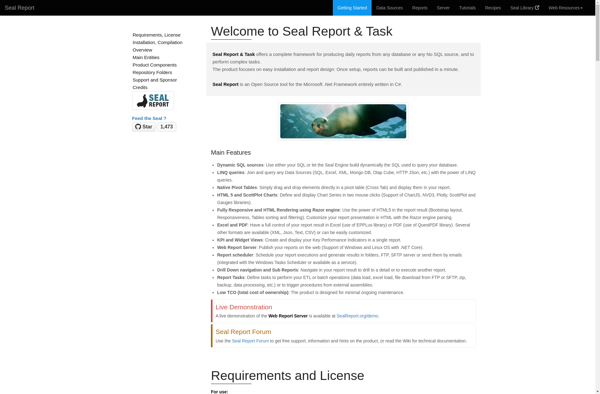
Seal Report is an open source business intelligence and reporting software. It provides an intuitive graphical interface and drag & drop features to easily create interactive dashboards, charts, reports and perform data analysis without needing coding skills.Key features of Seal Report include:Connect to multiple data sources like MySQL, PostgreSQL, Microsoft...
Windward Core is a document generation and reporting engine that can be licensed and integrated into other applications that need advanced document creation and editing capabilities.It provides a full featured template design interface that allows users to easily create complex, data-powered documents without any programming. Templates can include text, images,...
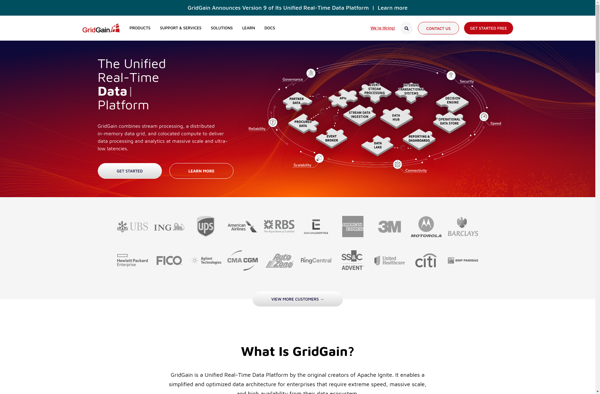
GridGain In-Memory Data Fabric is a distributed in-memory computing platform that enables organizations to develop data-intensive applications that require high performance and massive scalability. It provides an in-memory data grid that can be accessed by applications, allowing them to store and process data with in-memory speeds.Some key capabilities and benefits...
Telerik Reporting is a powerful report generation tool used to create richly formatted reports from a variety of data sources. It offers extensive report authoring capabilities including support for charts, maps, tables, shapes, images and more to build visually compelling and interactive reports.Some key features of Telerik Reporting include:Connect to...
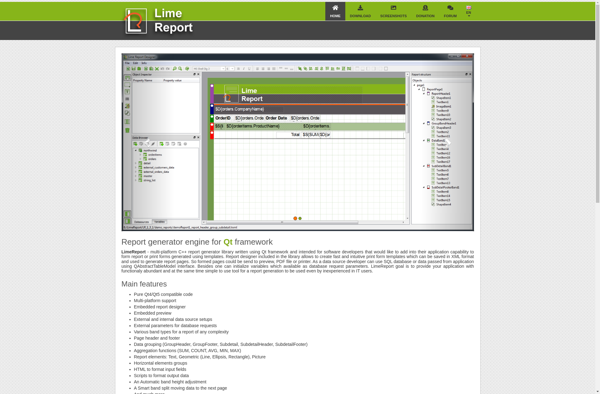
LimeReport is an open-source report generator and rendering engine that allows creating complex reports from various data sources. It is written in C++ and utilizes the Qt framework for the graphical user interface.Some key features and capabilities of LimeReport include:Visual report designer for drag & drop creation of report layouts...
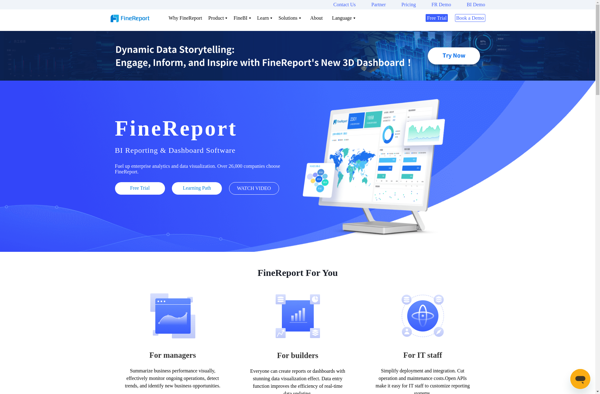
FineReport is a business intelligence and reporting solution developed by FineReport Software Co., Ltd. It provides an intuitive drag-and-drop interface for report design, allowing users to easily create interactive and visually engaging reports, dashboards, and data visualizations.Some key features of FineReport include:Connectivity to a wide range of data sources like...
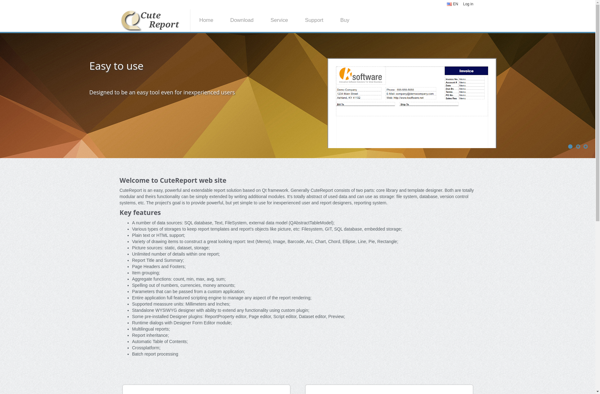
CuteReport is an open-source report creation system written in C++/Qt4. It enables developers to create any kind of reports and integrate them into their applications. The main advantages of CuteReport are:Visual report designer with drag and drop interfaceVarious kinds of diagrams and chartsSupport for multiple data sources: SQL queries, CSV...
myDBR is an intuitive and easy-to-use open-source database modeling and design application. It enables users to visually model database schemas for a variety of database management systems, including MySQL, MariaDB, PostgreSQL, SQLite, SQL Server, and Oracle.With myDBR, users can quickly design and visualize database structures, relationships, and constraints using drag-and-drop...
SharpDevelop Reports is an open source report designer and generation tool for .NET applications. It provides a visual report builder that allows developers to easily create rich, customizable reports including charts, images, tables, and more without writing code.Some key features of SharpDevelop Reports:Drag and drop report designer for building reports...