Pentaho is an open source business intelligence (BI) suite that provides data integration, analytics, reporting, data mining, and workflow capabilities. It is designed for use by businesses to unify data for analytics.
Pentaho is an open source business intelligence (BI) suite providing data integration, analytics, reporting, data mining, and workflow capabilities for unified data unification
What is Pentaho?
Pentaho is a comprehensive open source business intelligence (BI) suite that provides a range of data integration, analytics, visualization, reporting, data mining, and workflow capabilities. It is designed to help businesses consolidate data from disparate sources for unified analytics and reporting.
Some of the key capabilities and components of Pentaho include:
Data integration - The Pentaho Data Integration (PDI) tool, also known as Kettle, provides an easy to use graphical design environment for building ETL (Extract, Transform, Load) processes.
Analytics - The Pentaho BI platform and Pentaho Analysis services provide OLAP analytics with features like reporting, dashboards, and data mining.
Data visualization - Pentaho offers interactive reporting, charts, and dashboards through its open source reporting engine called Pentaho Reporting.
Workflow orchestration - The Pentaho suite includes a workflow orchestration engine that allows sequencing of jobs and setting dependencies.
Big data support - Through Pentaho Community Edition, it provides connectivity to Hadoop, Hive, HBase and related big data technologies.
Pentaho runs on Java and is supported on Windows, Linux, and Mac operating systems. It can connect to a wide range of data sources including relational databases, NoSQL databases, enterprise applications, big data systems and more.
Microsoft Power BI is a powerful business analytics service developed by Microsoft. It empowers users to transform raw data into meaningful insights, create interactive reports and dashboards, and share data-driven stories within an organization. Power BI is designed to help businesses and individuals make informed decisions based on a comprehensive...
Tableau is a leading business intelligence and data visualization platform used by organizations of all sizes to transform their data into easy-to-understand visualizations and dashboards. With Tableau, users can connect to a wide range of data sources, prepare and clean the data for analysis, and create interactive data visualizations such...
JasperReports is an open source Java reporting library that can generate various types of reports from different data sources. It is very flexible and offers many features:Supports connecting to various data sources like SQL databases, NoSQL databases, XML, JSON, CSV files, etc.Can generate reports in multiple formats including PDF, HTML,...
Crystal Reports is a flexible business reporting tool used to design and generate professional reports from virtually any data source. Originally created by Crystal Services and now owned by SAP, Crystal Reports has been around since the early 1990s and has become one of the most popular reporting tools used...
Talend is an open source data integration and management platform designed to help organizations effectively collect, transform, cleanse and share data across systems and teams. Some key capabilities and benefits of Talend include:Graphical drag-and-drop interface to build data integration jobs and workflows without codingOver 900 pre-built data connectors to leading...
QlikView is a business intelligence and data visualization platform used to create interactive dashboards and analytics applications. It was first released in 1993 by the Swedish company Qlik. Key features of QlikView include:Associative data modeling and in-memory analytics engine - Allows fast analysis of large, disparate datasets without predefined schema...
Alteryx is a data preparation and analytics software platform designed to make advanced data analytics accessible to any data worker. It provides an end-to-end platform to ingest, prepare, blend, analyze, and visualize data to gain deeper insights faster.Some key capabilities and benefits of Alteryx include:Intuitive drag-and-drop interface to prep and...
PHP Report Maker is an open-source PHP library that allows generating PDF and Excel reports from various data sources including MySQL, PostgreSQL, MS SQL, SQLite, Oracle, and CSV files. It provides a simple API for custom report building and formatting using PHP, helping developers and businesses automate business reporting and...
Stimulsoft Reports is a flexible business intelligence and reporting tool used to design and generate various types of reports. It provides an intuitive visual report designer for quickly building rich data visualizations and formatted reports.With Stimulsoft, you can connect to a wide variety of data sources including SQL databases, NoSQL...
Google Fusion Tables is a cloud-based service designed for working with structured data. It allows users to upload, host, manage, share, visualize and collaborate on tabular datasets. Some of the key features of Google Fusion Tables include:Data importing from various formats like CSV, KML, spreadsheetsData exporting to formats like CSV...
SAP BusinessObjects is a comprehensive business intelligence and analytics software suite from SAP. It brings together capabilities for reporting, analysis, dashboards, data visualization, data discovery, and more to help organizations unlock value from their data.Key capabilities and components of SAP BusinessObjects include:Centralized semantic layer for consistent data across the organizationPowerful...
Panxpan is a free and open source spreadsheet application that offers functionality and features comparable to Microsoft Excel. It allows users to create spreadsheets, organize and analyze data, create charts and graphs, perform calculations using formulae and functions, and collaborate with others.Some key features of Panxpan include:Import and export to...
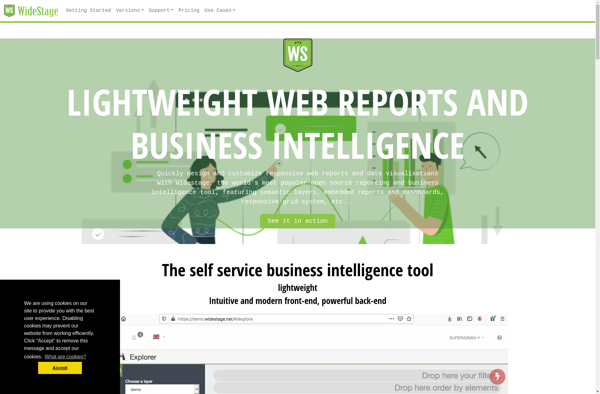
Widestage is an enterprise-grade platform for live video streaming, webinars, and webcasts. It enables businesses, event organizers, education institutions and media publishers to easily broadcast content in real-time to engage with their audience.Key features of Widestage include:Intuitive dashboards for managing live events, presenters, registration, and branding.Robust viewing portal allowing viewers...
ASP.NET Report Maker is an open-source reporting solution for ASP.NET web applications. It provides a drag-and-drop report designer for building rich data reports and dashboards that can be integrated seamlessly into ASP.NET projects.Key features include:Visual report designer for quick report buildingSupport for charts, tables, gauges, maps and other data visualizationsAbility...
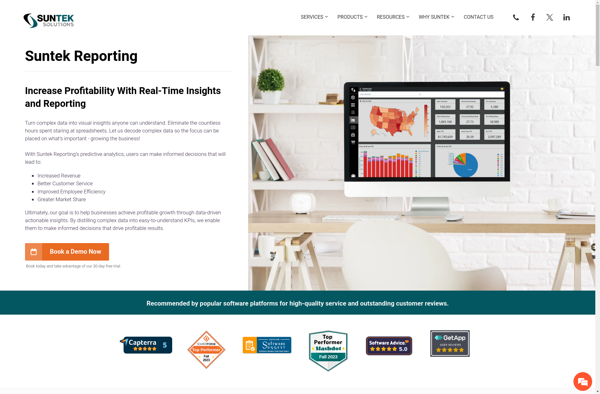
Suntek Reporting is a flexible business intelligence and reporting solution designed to help companies gain better insights from their data. Some key features include:Intuitive drag-and-drop interface to build reports and dashboards quickly without codingConnectivity to a wide range of data sources including SQL Server, MySQL, Oracle, AWS, and morePowerful data...
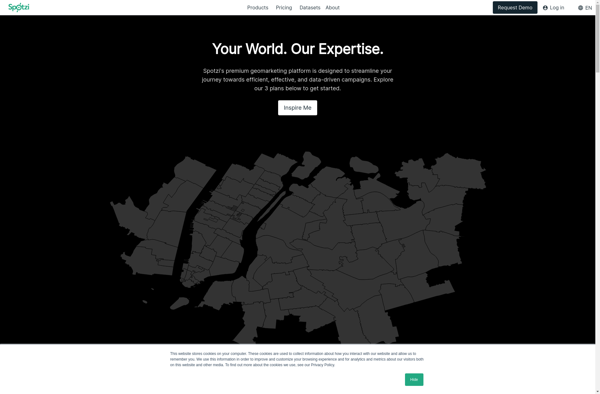
Spotzi is an alternative music streaming service similar to Spotify. It has many of the same core features as Spotify such as:Streaming music on-demandPlaylists and music recommendationsSocial features to follow friends and artistsMobile and desktop appsWhere Spotzi differs from Spotify is its focus on emerging and independent artists. Over half...
LightCat is an emerging open-source password manager that allows users to securely store website logins, credit card numbers, identities, and other sensitive information behind one master password. It utilizes strong AES-256 bit encryption to protect user data and ensures information is accessible only to the owner.Some key features of LightCat...
Valentina Reports is an open-source ad-hoc reporting tool that allows users to create rich visual reports and dashboards from various data sources including SQL & NoSQL databases, Excel, CSV files, Web APIs, and more. It has a graphical drag-and-drop report designer so users can build reports without coding.Key features include:Connectivity...
Tableau Prep is a self-service data preparation application designed to empower users to quickly and easily combine, shape, and clean their data to speed up analytics. Key features include:Intuitive visual interface - Tableau Prep allows users to eliminate complex coding and scripting to prepare data through visual steps and drag-and-drop...
Colombian Report Designer is a comprehensive reporting solution used to design, manage, and distribute a wide variety of business reports. With its intuitive drag-and-drop interface, users can easily create polished, professional-looking reports without coding.Some key features include:Drag-and-drop report designer with a wide selection of charts, tables, images, and other visual...
MicroStrategy is a leading enterprise analytics platform designed to help organizations make data-driven business decisions through advanced visualization and dashboarding capabilities. It serves as a one-stop solution for BI, allowing for data preparation, discovery, reporting, and predictive analytics.Key features of MicroStrategy include:Interactive dashboards and pixel-perfect reports that can be accessed...
LinceBI is an open-source business intelligence and data visualization platform used to analyze and visualize data for better business insights. It provides an intuitive drag-and-drop interface to create interactive dashboards, reports, charts and graphs without the need for coding.Some key features of LinceBI include:Connectivity to multiple data sources such as...
DynamicReports is an open-source Java library for creating rich reports and dashboards. It provides a simple API for building complex layouts with tables, charts, images, and more without the need for specialized reporting tools.Some key features of DynamicReports:Runs on Java 8+ so integrates easily into Java web appsCreates PDF, Excel,...
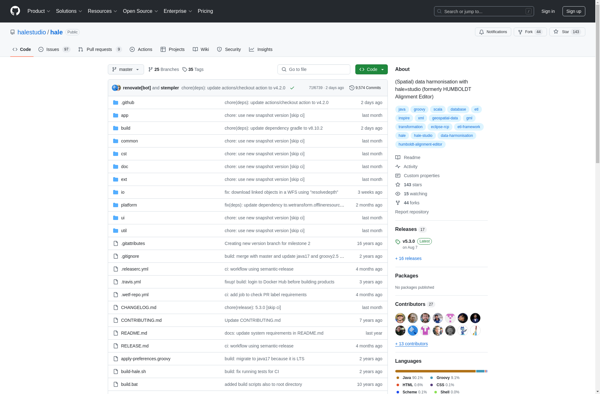
Hale Studio is an open source platform for data alignment, transformation, and enrichment. It provides a graphical user interface to manage complex data mappings for various data integration and transformation scenarios.Some key features and capabilities:Supports various data formats like XML, JSON, CSV, databases, etc.Aligns and transforms data models using a...
Amazon QuickSight is a fast, cloud-powered business intelligence service that makes it easy to build visualizations, perform ad-hoc analysis, and quickly get business insights from your data. Some key features include:Intuitive visual interface that makes it easy to visualize and explore dataBroad data connectivity to connect to data sources like...
Advanced ETL Processor Enterprise is a robust and scalable extract, transform, and load (ETL) solution designed for enterprise use. It provides a wide range of connectivity to different data sources and destinations, along with powerful data transformation capabilities.Key features include:Graphical workflow designer to visually map out ETL processesOver 200 pre-built...
Jedox is a comprehensive business intelligence and corporate performance management platform designed for mid-size to large enterprises. It provides a wide range of capabilities including:Multi-dimensional online analytical processing (OLAP) for complex data analysis and modelingPlanning, budgeting, and forecasting features for financial planning and simulationCustomizable dashboards and self-service reporting for business...
CloudWork is a popular cloud-based project management and team collaboration software. It provides a wide range of features to help teams plan projects, assign tasks, manage workflows, track progress, and collaborate effectively.Some of the key features of CloudWork include:Intuitive dashboards and views - Gantt charts, Kanban boards, calendar views, and...
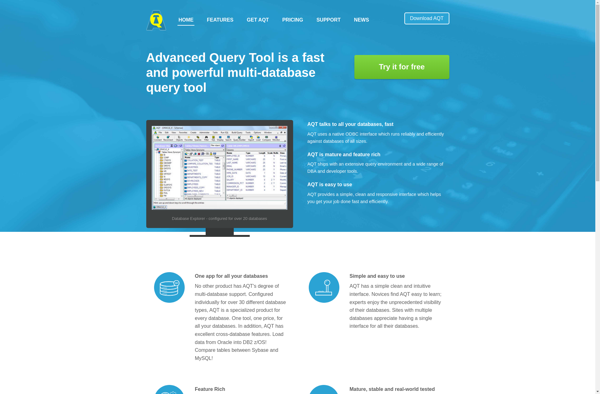
Advanced Query Tool (AQT) is an open-source, cross-platform data querying and reporting tool designed to simplify and speed up the process of connecting to databases, files, applications and services to visually build SQL queries and generate reports.With its easy-to-use graphical interface, AQT allows users to generate complex SQL queries without...
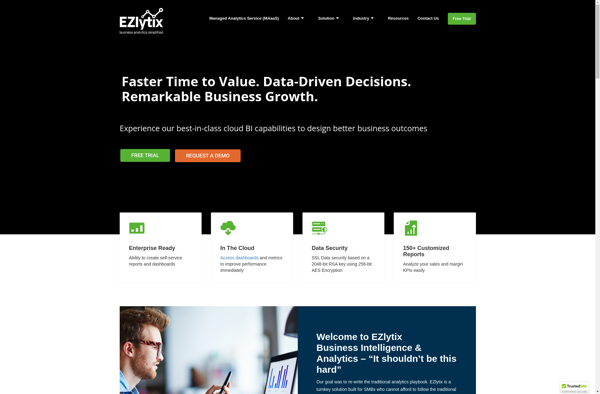
EZlytix is a business intelligence and data analytics software designed to help companies make data-driven decisions. It allows users to connect to various data sources, prepare and cleanse data, and create interactive dashboards and reports to gain insights.Some key features of EZlytix include:Intuitive drag-and-drop interface to build workflows, dashboards and...
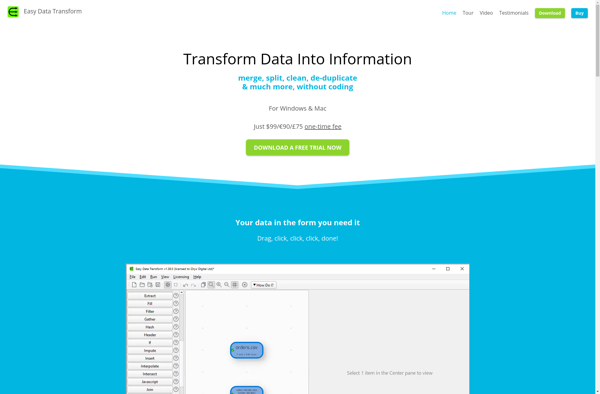
Easy Data Transform is a powerful yet intuitive desktop application for data transformation, cleaning and manipulation. It works on Windows, Mac and Linux operating systems.With its easy-to-use graphical interface, you can quickly combine, compare, validate, modify, split, filter, aggregation or perform other operations on multiple data sources like CSV, JSON,...
QueryTree is a visual SQL analytics software designed to make query building fast and easy for any skill level. It features an intuitive drag-and-drop interface that allows users to construct complex SQL queries visually without typing code.Some key features of QueryTree include:Visual query builder with drag-and-drop fields and quick type...
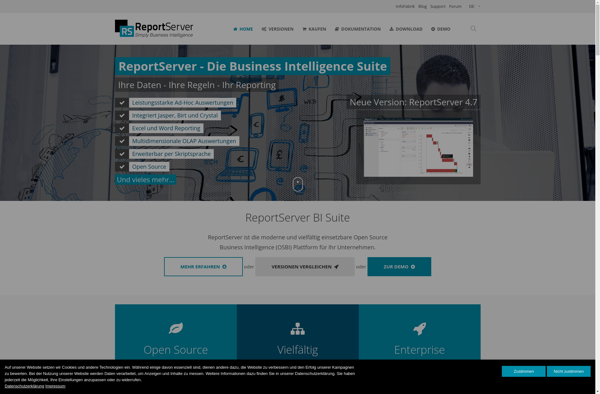
ReportServer is an open source business intelligence and reporting platform used to create and distribute interactive reports and dashboards. It supports connecting to various relational and NoSQL databases, flat files, REST APIs, and other data sources to build reports.Some key capabilities and benefits of ReportServer include:Ad-hoc reporting for business users...
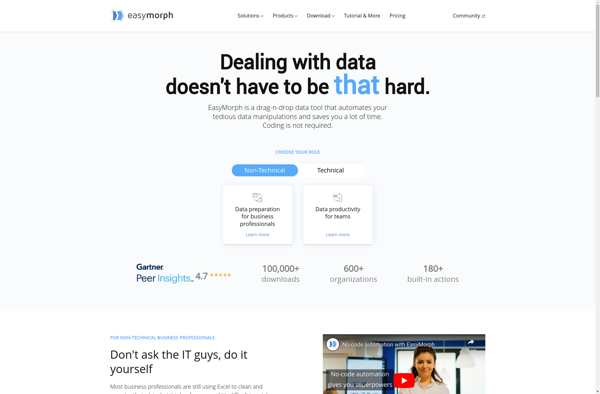
EasyMorph is a versatile data transformation and ETL (extract, transform, load) desktop application used by both technical and non-technical users. It provides a visual, no-code interface for quickly combining, cleaning, and reshaping data from various sources like Excel, CSV files, databases and other applications and loading it into destination files...
Datapine is an easy-to-use business analytics and dashboard software designed to help businesses visualize, analyze and gain insights from their data. It provides powerful tools to access, clean, unify and model data from multiple sources, including SQL and NoSQL databases, cloud apps, spreadsheets, CSV files and more.Key features of Datapine...
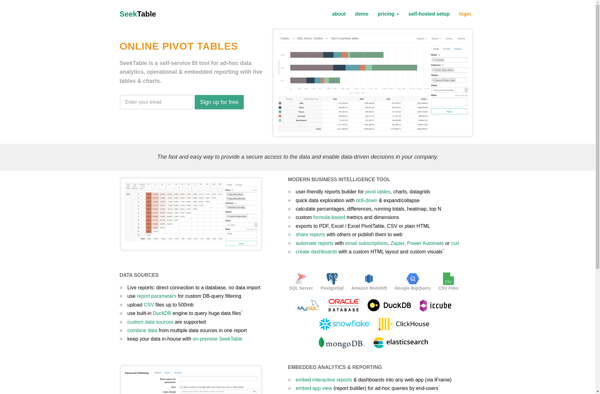
SeekTable is a browser extension and web app that helps you navigate websites more efficiently. It works by outlining tables, charts, and graphs on web pages so you can easily scan, search, and summarize data.Once installed, SeekTable will detect tables, charts, and graphs on a web page and draw red...
Telerik Reporting is a powerful report generation tool used to create richly formatted reports from a variety of data sources. It offers extensive report authoring capabilities including support for charts, maps, tables, shapes, images and more to build visually compelling and interactive reports.Some key features of Telerik Reporting include:Connect to...
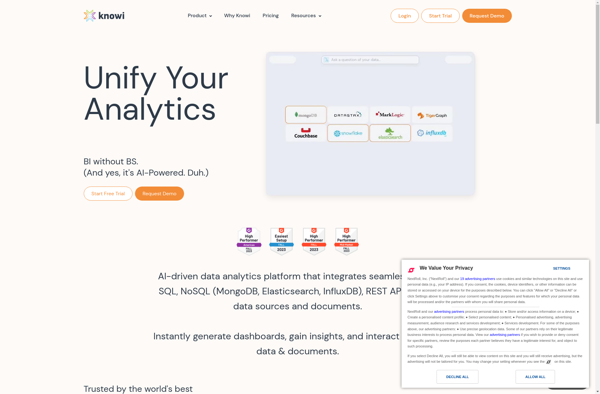
Knowi is a business intelligence and analytics software that provides tools for data visualization, reporting, and dashboard creation. It allows non-technical users to easily access, analyze, and visualize data without needing to know SQL or coding.Some key features of Knowi include:Drag-and-drop interface to build interactive dashboards, charts, reports and visualizationsBroad...
SpagoBI is an open-source business intelligence (BI) suite that provides a wide range of analytical and reporting capabilities for data analysis and visualization. It allows organizations to build interactive dashboards, reports, charts, widgets and what-if analysis to get valuable insights from their data.Some of the key features of SpagoBI include:Interactive...
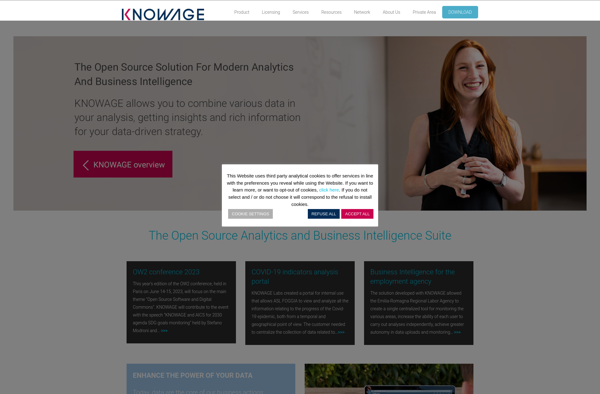
Knowage is an open-source business intelligence and data analytics platform. It provides a wide range of features for extracting insights from data, including:Interactive dashboards and reports for data visualizationAd-hoc reporting and analysisAdvanced data visualization with charts, graphs, and mapsData mining and OLAP analysisScorecards and KPI managementData integration from multiple sourcesResponsive...
Angoss KnowledgeSEEKER is a comprehensive data mining and predictive analytics platform used to uncover patterns and relationships in data to improve decision making. It helps organizations leverage their data by providing capabilities for:Data preparation and cleansing - KnowledgeSEEKER provides tools to profile, cleanse, transform, aggregate, sample, and partition data to...
Oracle OLAP is an online analytical processing (OLAP) technology developed by Oracle Corporation as part of the Oracle Database. It allows users to analyze data across multiple dimensions with complex hierarchies and calculations at very fast speeds.Some key features of Oracle OLAP include:Multidimensional data model to capture business metrics and...
Stagraph is a powerful yet easy-to-use data visualization and analytics platform designed for modern business needs. As a cloud-based solution, Stagraph enables users to effortlessly map, analyze, and gain actionable insights from even the most complex data sets through intuitive drag-and-drop visualizations.Key capabilities and benefits include:Intelligible and interactive data visualizations...
InfoCaptor Dashboard is a business intelligence and analytics platform designed to help companies consolidate their data, create customized dashboards and reports, and uncover valuable insights. Some key features of InfoCaptor Dashboard include:Data connectivity and ETL - Connect to data from multiple sources like SQL and NoSQL databases, cloud apps, Excel,...
LogiXML is a business intelligence and analytics software platform used by organizations to access, analyze, visualize and share data. It allows companies to create interactive dashboards, pixel-perfect reports, and compelling data visualizations that provide actionable insights.Some key features of LogiXML include:Drag-and-drop interface to build reports and dashboards quickly without codingBroad...
Domino Data Lab is an end-to-end platform for data science teams to collaboratively build, deploy, and monitor analytical models. It brings together data science workloads across the model development lifecycle with integrated security, governance, and automation capabilities.Key capabilities and benefits of Domino Data Lab include:Centralized workspace for data science teams...
KoolReport is an open-source PHP reporting library for faster and easier data reporting. Key features include:Easy and intuitive report creation with minimal codeSupport for variety of data sources: SQL databases, CSV/Excel files, etc.Various chart types including Line, Bar, Pie, Table, Pivot Table, Gauge Chart etc.Interactive reports and dashboardsExport reports to...
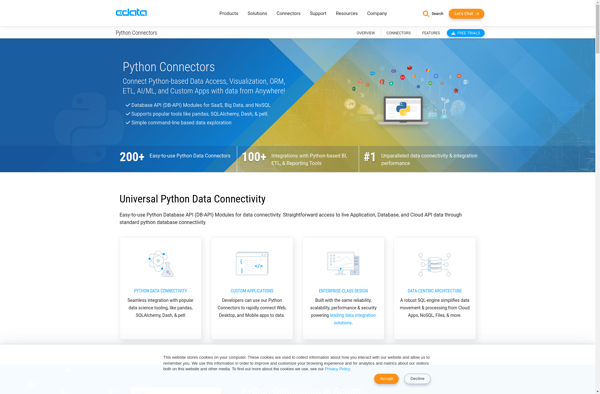
CData Python Connectors enable Python developers to easily connect to databases, cloud apps, and on-prem data using standard Python DB API interfaces. The connectors integrate natively with Python, eliminate the need to map values to Python types, and accelerate app development.Key benefits include:Standard Python DB API 2.0 interface for connecting...
SplashBI is a cloud-based business intelligence and data visualization platform designed for small and medium businesses. Some key features of SplashBI include:Intuitive drag-and-drop interface for building interactive dashboards, charts, tables and reportsLibrary of customizable widgets and visualizations including bar, line and pie chartsAutomated report scheduling and distributionReal-time data connectivity to...
Datameer is an end-to-end data analytics and business intelligence platform built to enable organizations to extract valuable insights from massive datasets from various sources. It simplifies data integration, exploration, and analytics across Hadoop, Spark, cloud platforms, data warehouses, spreadsheets, and more.Key capabilities and benefits of Datameer include:Intuitive spreadsheet-like interface to...
Datacopia is an open-source data workflow and pipeline tool designed for integrating, moving, and transforming data across databases, data warehouses, lakes, and other systems. It provides an easy to use visual interface to build and manage complex data pipelines without coding.Key features of Datacopia include:Visual data pipeline designer to model...
Platfora is a big data analytics software designed to help companies make sense of large and complex datasets. It provides an interactive visual interface that allows business users to analyze big data without needing to know how to code.Some key features of Platfora include:Intuitive visual workflows for exploring datasetsIn-memory processing...
Snapshot BI is a business intelligence and analytics software designed specifically for small and medium-sized businesses. It provides an easy-to-use platform for companies to visualize, analyze, and gain actionable insights from their business data.Key features of Snapshot BI include:Interactive dashboards and reports - Create customized dashboards with drag-and-drop widgets to...
icStorm is an open-source, self-hosted agile project management application designed for small development teams. It offers similar core functionality as IceScrum, allowing teams to plan and track software projects using agile methodologies like Scrum and kanban.Key features of icStorm include:Customizable kanban boards to visualize workflow and track progressBacklogs for capturing...
Parrily is a cloud-based project management and team collaboration software designed specifically for agile development teams. It provides a variety of features to help manage projects, track progress, and facilitate teamwork:- Kanban boards - Visualize tasks and user stories on digital kanban boards. Move items through defined workflows to track...
KiniMetrix is a cloud-based software platform designed for healthcare providers to help them better manage their practices, engage with patients, gain population health insights, and handle administrative tasks. It combines features typically found in separate electronic health record (EHR), practice management, patient portal and business intelligence solutions into one unified...
Birst is a cloud-native business intelligence and analytics platform used by enterprises to unify, understand, and act on data. Key capabilities and benefits include:Cloud data warehousing to bring together data from multiple sources for analysisInteractive dashboards and visualizations to spot trends and insightsSelf-service analytics empowering users across the organization to...
Sense Platform is an open-source business intelligence and analytics platform designed to make complex data stacks understandable and accessible to everyone across an organization. It provides a full range of tools for data integration, analysis, and visualization to help companies understand and extract valuable insights from their data.Some key capabilities...
Gaio is an open-source monitoring and observability platform optimized for cloud-native infrastructure and applications. It provides comprehensive visibility into systems, services, and applications deployed in public, private, or hybrid cloud environments.Some key capabilities and benefits of Gaio include:Metrics - Ingest, process, store and visualize metrics from hosts, containers, services, and...
Xplenty is a cloud-based ETL (extract, transform, load) and data integration platform designed to help users effectively prepare and analyze data from diverse sources. Some key features of Xplenty include:Intuitive drag-and-drop interface for building automated data pipelines without codingPre-built integrations with 100+ data sources and destinations like databases, data warehouses,...
CollateBox is a free online application designed to help researchers and academics organize, manage, and share their PDF documents and research papers in one central location. It serves as a digital research repository that aims to make collecting, sorting, and accessing academic papers and literature more efficient.Some key features of...
Bime is a flexible business intelligence and analytics platform suitable for modern data teams. It provides an easy way to connect to various data sources like databases, cloud apps, and business software to build interactive dashboards, reports, and analytics.Some key capabilities and benefits of Bime include:Intuitive drag-and-drop interface to visualize...
Alpine Chorus is an audio plugin for Mac and Windows designed specifically for creating vocal harmonies and choruses. Some of the key features include:Up to 24 harmony voices, with control over chord type, inversion, and spreadAutomatic pitch correction and formant/voice shifting for natural sounding harmony vocalsBuilt-in reverb, delay, modulation, and...
GoodData is a business intelligence and analytics platform used by companies to collect, store, and analyze their data to drive business decisions. Some key capabilities and features of GoodData include:Data warehousing and ETL - GoodData ingests data from various sources, transforms it, and loads it into a cloud data warehouse...
Analyza is a business intelligence and data analytics software platform designed to help companies make data-driven decisions. It provides tools for data preparation, interactive visualization, dashboarding, reporting, and predictive analytics.Key features of Analyza include:Intuitive drag-and-drop interface for building dashboards and reports without codingHundreds of customizable data visualization options including charts,...
SharpDevelop Reports is an open source report designer and generation tool for .NET applications. It provides a visual report builder that allows developers to easily create rich, customizable reports including charts, images, tables, and more without writing code.Some key features of SharpDevelop Reports:Drag and drop report designer for building reports...
Mode Analytics is a powerful, cloud-based business intelligence and analytics platform designed to help companies visualize, analyze, and share data to drive better business decisions. With an intuitive drag-and-drop interface, Mode makes it easy for users to connect multiple data sources, build interactive reports and dashboards, and collaborate across teams.Some...
Prognoz is a comprehensive business forecasting and predictive analytics platform designed to help organizations improve forecast accuracy and operational efficiency. It leverages sophisticated artificial intelligence algorithms, time series analysis, simulation modeling, and machine learning techniques to uncover patterns in historical data and generate accurate demand forecasts.Key features of Prognoz include:Intuitive...
Hugo is an open-source static site generator created by Steve Francia in 2013. It is written in Go programming language and developed on GitHub. Hugo utilizes Markdown for content, has built-in sass/scss support for styling, and is known for its speed and flexibility.Some key features of Hugo include:Extremely fast build...
Astera Centerprise is an end-to-end data integration and data management platform designed to help organizations combine data from multiple sources, transform and cleanse that data, and reliably load it into databases, data warehouses, analytics systems, and other applications. Some key features and capabilities of Centerprise include:Graphical, codeless data mapping and...
Centius Qi is an intuitive, code-free business automation platform powered by artificial intelligence. It helps companies eliminate manual processes, automate repetitive tasks, and streamline workflows across the organization.With an easy-to-use drag and drop interface, Centius allows anyone to build workflows, set up integrations, create intelligent chatbots, gather actionable insights from...
Logi Vision is a beginner-friendly video editing software for Windows and Mac. It provides an easy-to-use timeline interface to edit your video clips, add transitions between clips, apply titles and effects, adjust color, edit audio, and export your finished videos.Some key features of Logi Vision include:Intuitive drag-and-drop timeline editing interface...
Sybase IQ is an analytical database management system optimized for data warehousing, analytics, and business intelligence. It utilizes a column-oriented storage model designed to provide higher performance for analytic queries while using lower storage space compared to row-oriented databases.Key features and capabilities of Sybase IQ include:Column-oriented storage and vectorized query...
Keboola Connection is a cloud-based data integration and transformation platform designed to help businesses efficiently manage their data pipelines and gain actionable insights. Some key features of Keboola Connection include:Drag-and-drop interface to visually build data workflows and ETL processes without codingPre-built connectors to easily integrate data from various sources like...
Diyotta 4.0 is an open-source data integration and ETL (Extract, Transform, Load) platform optimized for big data use cases. It provides a scalable, flexible, and resilient data pipeline to move and transform data between various sources like databases, object stores, message queues, REST APIs, files, etc. and destinations like databases,...
ProClarity is a business intelligence and analytics software designed to help organizations make data-driven decisions. It provides an interactive dashboard and data visualization capabilities to easily analyze large datasets from multiple sources.Key features of ProClarity include:Drag-and-drop interface to quickly build dashboards and visualizationsBroad connectivity to import data from SQL Server,...
Planchette Online is a free web-based Ouija board experience that allows users to have a simulated séance without needing to purchase a physical Ouija board. Users simply visit the Planchette Online website and are greeted with a realistic 3D rendering of a classic Ouija board on a wooden table.To start...
Soley Studio is an open-source modeling tool for creating UML diagrams and Business Process Model and Notation (BPMN) workflows. It provides a comprehensive environment for software design and business process modeling.With its simple and intuitive graphical interface, Soley Studio makes it easy to build various diagrams such as use case...
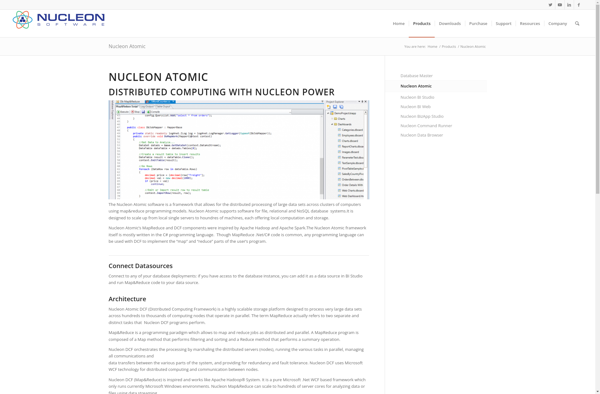
Nucleon BI Studio is a self-service business intelligence and analytics platform used by organizations to visualize, analyze, and share data insights. It provides an intuitive drag-and-drop interface that enables users without technical skills to easily build interactive dashboards, reports, and workflows to gain actionable insights from their data.Key capabilities and...
bipp Analytics is a business intelligence and data visualization software that empowers users to connect their data, analyze it visually, and extract meaningful insights. Some key features of bipp Analytics include:Data Connectors - Connect your data from databases, cloud apps, Excel, etc. with pre-built connectors.Interactive Dashboards - Build visually appealing,...
KPI Watchdog is a robust business intelligence and data analytics platform designed to help companies track, analyze, and visualize key performance indicators (KPIs) in real-time. It provides powerful, customizable dashboards and reporting tools to monitor essential metrics across all departments and roles.With KPI Watchdog, businesses can connect data from multiple...
SQLwallet is an open-source SQL database engine built with a focus on security, encryption, and privacy. Developed by a team of database experts and cryptographers, SQLwallet aims to make handling confidential user data easier for developers.Some key features of SQLwallet include:End-to-end encryption for data at rest and in transitFine-grained access...
Palo Alto Networks' Palo Suite is an integrated platform that delivers a broad range of cybersecurity capabilities for enterprises. It brings together network security, cloud security, advanced threat prevention, and more into a single offering.At the core of Palo Suite is the company's next-generation firewalls, which provide granular visibility and...
Bouquet is an open-source and free office suite that provides alternatives to Microsoft Office apps like Word, Excel, and PowerPoint. It includes a word processor, spreadsheet program, and presentation software that allows users to create, edit, and share documents, spreadsheets, and slide decks.The word processor, Bouquet Words, provides similar functionality...
DrillDb is an open-source distributed SQL query engine for big data. It was originally developed by MapR and is now managed by the Apache Software Foundation. DrillDb allows users to analyze a variety of NoSQL databases and file systems without requiring them to structure the data upfront.Some key features and...