Datacopia is an open-source data workflow tool for loading, transforming, and moving data between databases, data warehouses, lakes, and other systems. It provides a visual interface to build and schedule ETL and ELT data pipelines.
Datacopia is an open-source data workflow tool for loading, transforming, and moving data between databases, data warehouses, lakes, and other systems. It provides a visual interface to build and schedule ETL and ELT data pipelines.
What is Datacopia?
Datacopia is an open-source data workflow and pipeline tool designed for integrating, moving, and transforming data across databases, data warehouses, lakes, and other systems. It provides an easy to use visual interface to build and manage complex data pipelines without coding.
Key features of Datacopia include:
Visual data pipeline designer to model data workflows
Connectors to databases like PostgreSQL, MySQL, SQL Server, and data warehouses like Snowflake and BigQuery
ELT and ETL support for transforming and moving data
Scheduling capabilities for running pipelines on triggers or timers
Monitoring of pipeline runs with alerts, logging, and metrics
Collaboration features to share and manage pipelines across teams
Open-source platform that can be self-hosted or used as a managed cloud service
Datacopia simplifies the process of automating and managing data integration workloads. With its intuitive drag-and-drop interface, pipelines can be built without extensive coding expertise which helps accelerate analytics and data science initiatives. It can handle large volumes of data and complex transformations efficiently in the cloud or on-premises.
Because Datacopia is open source, it provides more flexibility as well as the opportunity for customizations not available from proprietary ETL tools. Overall, Datacopia is designed to make data pipeline orchestration and workflow management easier for both technical and non-technical users.
Datacopia Features
Features
Visual interface to build data workflows/pipelines
Microsoft Power BI is a powerful business analytics service developed by Microsoft. It empowers users to transform raw data into meaningful insights, create interactive reports and dashboards, and share data-driven stories within an organization. Power BI is designed to help businesses and individuals make informed decisions based on a comprehensive...
Tableau is a leading business intelligence and data visualization platform used by organizations of all sizes to transform their data into easy-to-understand visualizations and dashboards. With Tableau, users can connect to a wide range of data sources, prepare and clean the data for analysis, and create interactive data visualizations such...
Pentaho is a comprehensive open source business intelligence (BI) suite that provides a range of data integration, analytics, visualization, reporting, data mining, and workflow capabilities. It is designed to help businesses consolidate data from disparate sources for unified analytics and reporting.Some of the key capabilities and components of Pentaho include:Data...
Plotly is an open-source graphing library that allows users to create interactive, publication-quality graphs, charts, and dashboards. It supports Python, R, JavaScript, and Excel as programming languages. Some key features of Plotly include:Interactive visualization - Plotly charts are interactive with features like hover text, zooming, panning, selectable legends, and editable...
Google Fusion Tables is a cloud-based service designed for working with structured data. It allows users to upload, host, manage, share, visualize and collaborate on tabular datasets. Some of the key features of Google Fusion Tables include:Data importing from various formats like CSV, KML, spreadsheetsData exporting to formats like CSV...
D3.js, or D3, is an open-source JavaScript library used for visualizing data with web standards. D3 stands for Data-Driven Documents. It allows developers to bind arbitrary data to the Document Object Model (DOM) and then apply data-driven transformations to the document. This allows web developers to create dynamic, interactive data...
Amazon QuickSight is a fast, cloud-powered business intelligence service that makes it easy to build visualizations, perform ad-hoc analysis, and quickly get business insights from your data. Some key features include:Intuitive visual interface that makes it easy to visualize and explore dataBroad data connectivity to connect to data sources like...
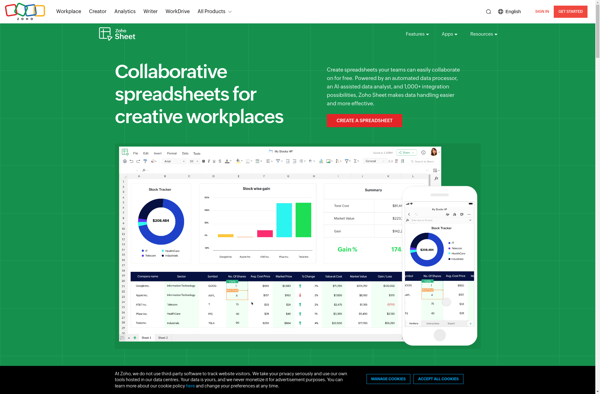
Zoho Sheet is an online spreadsheet software application developed by Zoho Corporation. It is part of the Zoho Office Suite which includes other office productivity tools like a word processor, presentation software, and more.As an online spreadsheet software, Zoho Sheet provides core spreadsheet functionality like calculations, pivot tables, charts, and...
Marple is an open-source, Markdown-based slide deck tool for creating presentations. It provides a minimalistic editor interface to write slide content in Markdown format, which then gets rendered into an elegant slide deck for presenting.Some key features of Marple:Write slide content in easy-to-read and write Markdown format. Format headings, lists,...
RAWGraphs is a free, open-source web tool created for anyone to easily visualize and share data using the most common graphical formats. The simple drag and drop interface makes it easy for non-experts to quickly generate a wide variety of charts and diagrams that can be exported and shared as...
Charte.ca is a Canadian website that specializes in providing suggestions and comparisons of various software products and online services. Its goal is to help users make informed decisions when choosing software and web applications.The site covers a wide range of categories including creative tools, productivity software, cloud storage, website builders,...
Soley Studio is an open-source modeling tool for creating UML diagrams and Business Process Model and Notation (BPMN) workflows. It provides a comprehensive environment for software design and business process modeling.With its simple and intuitive graphical interface, Soley Studio makes it easy to build various diagrams such as use case...
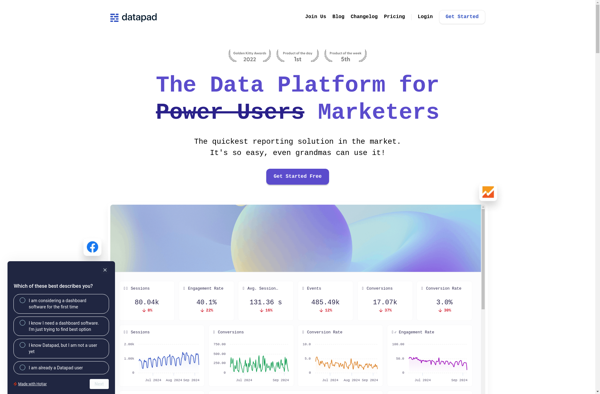
DataPad is a user-friendly data analysis and visualization software designed for researchers of all levels. With its intuitive drag-and-drop interface, DataPad allows users to easily import, clean, analyze and visualize complex datasets without coding.Key features include:Import data from CSV, Excel, databases and other sourcesInteractive drag-and-drop workflow to clean, analyze and...