Tableau is a popular business intelligence and data visualization software. It allows users to connect to data, create interactive dashboards and reports, and share insights with others. Tableau makes it easy for anyone to work with data, without needing coding skills.
Tableau: Business Intelligence & Data Visualization Software
Tableau is a popular business intelligence and data visualization software. It allows users to connect to data, create interactive dashboards and reports, and share insights with others. Tableau makes it easy for anyone to work with data, without needing coding skills.
What is Tableau?
Tableau is a leading business intelligence and data visualization platform used by organizations of all sizes to transform their data into easy-to-understand visualizations and dashboards. With Tableau, users can connect to a wide range of data sources, prepare and clean the data for analysis, and create interactive data visualizations such as charts, maps, dashboards, and stories to uncover key insights.
Some key capabilities and benefits of Tableau include:
Powerful and intuitive drag-and-drop interface for data analysis, making it easy for anyone to work with data
Rich visual analytics capabilities including a wide range of charts, graphs, dashboards, and mapping functionalities
In-memory data engine providing fast querying and analysis, even on large or complex data sets
Data blending from multiple sources into a unified view for integrated analysis
Collaboration features to share dashboards and analytics securely across teams and organizations
Options for embedding analytics into applications or websites to reach more users
Mobile optimization providing responsive dashboards accessible on the go from phones and tablets
With its flexibility, ease of use, and robust visualization capabilities, Tableau is trusted by leading corporations, small businesses, and non-profits to help transform their data into impactful business insights.
Tableau Features
Features
Drag-and-drop interface for data visualization
Connects to a wide variety of data sources
Interactive dashboards with filtering and drilling down
Mapping and geographic data visualization
Collaboration features like commenting and sharing
Grafana is a feature-rich, open source analytics and monitoring visualization suite. It integrates tightly with a variety of database technologies like Graphite, Prometheus, InfluxDB, Elasticsearch, and more to allow for easy exploration and visualization of time series data. Some key capabilities and benefits of Grafana include:Intuitive graphical UI makes it...
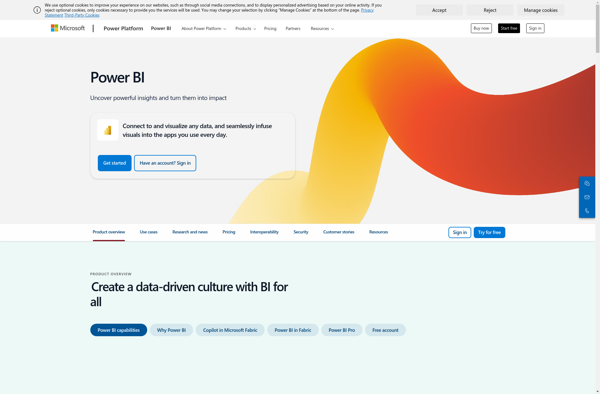
Microsoft Power BI is a powerful business analytics service developed by Microsoft. It empowers users to transform raw data into meaningful insights, create interactive reports and dashboards, and share data-driven stories within an organization. Power BI is designed to help businesses and individuals make informed decisions based on a comprehensive...
Metabase is an open source business intelligence platform and analytics tool. It allows anyone on a team to ask questions about their data, explore it, and share insights with others through easy-to-create dashboards, charts, and visualizations. Metabase provides an intuitive frontend interface so users can get answers and discover trends...
Talend is an open source data integration and management platform designed to help organizations effectively collect, transform, cleanse and share data across systems and teams. Some key capabilities and benefits of Talend include:Graphical drag-and-drop interface to build data integration jobs and workflows without codingOver 900 pre-built data connectors to leading...
QlikView is a business intelligence and data visualization platform used to create interactive dashboards and analytics applications. It was first released in 1993 by the Swedish company Qlik. Key features of QlikView include:Associative data modeling and in-memory analytics engine - Allows fast analysis of large, disparate datasets without predefined schema...
Gephi is an open-source, cross-platform network analysis and visualization software package developed in Java. It allows users to visualize, interactively explore, spatially arrange, manipulate, and statistically analyze network graphs made up of nodes and edges. Gephi provides easy and broad access to complex network data in order to help applied...
Apache Superset, formerly known as Caravel, is an open-source business intelligence (BI) web application. It was created by Maxime Beauchemin at Airbnb.Superset allows you to explore and visualize data, create interactive dashboards, and share insights across your organization. It integrates with common database technologies like MySQL, Postgres, SQL Server, and...
Pentaho is a comprehensive open source business intelligence (BI) suite that provides a range of data integration, analytics, visualization, reporting, data mining, and workflow capabilities. It is designed to help businesses consolidate data from disparate sources for unified analytics and reporting.Some of the key capabilities and components of Pentaho include:Data...
Plotly is an open-source graphing library that allows users to create interactive, publication-quality graphs, charts, and dashboards. It supports Python, R, JavaScript, and Excel as programming languages. Some key features of Plotly include:Interactive visualization - Plotly charts are interactive with features like hover text, zooming, panning, selectable legends, and editable...
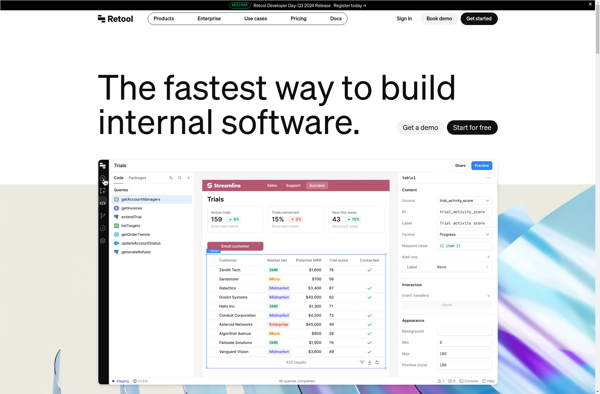
Retool is a low-code development platform designed to help teams build internal tools and business applications faster. It provides an easy-to-use drag and drop interface that allows you to quickly build workflows, forms, charts, kanban boards and more without needing to write any code.Some key features of Retool include:Connects to...
NumeRe is an open-source platform for numerical computing, data analysis, and scientific visualization. It provides a MATLAB-like environment and programming language focused on matrix operations, linear algebra routines, statistical analysis, and plotting. Some key features of NumeRe include:Fast vector/matrix math operations through integration of BLAS and LAPACK librariesA high-level scripting...
Google Fusion Tables is a cloud-based service designed for working with structured data. It allows users to upload, host, manage, share, visualize and collaborate on tabular datasets. Some of the key features of Google Fusion Tables include:Data importing from various formats like CSV, KML, spreadsheetsData exporting to formats like CSV...
Datamatic.io is a cloud-based no-code data pipeline platform that allows users to build data integration, transformation, and loading processes without needing to write any code. Some key features of Datamatic.io include:Graphical interface to visually design data pipelines by connecting various pre-built data source and destination connectors as well as transformation...
Snapboard is an online visual collaboration software used by teams for brainstorming, organizing workflows, managing projects, and more. It provides an infinite virtual whiteboard where users can add sticky notes, images, freehand drawings, and diagrams to capture ideas and map out plans.Key features of Snapboard include:Infinite canvas for adding unlimited...
SAP BusinessObjects is a comprehensive business intelligence and analytics software suite from SAP. It brings together capabilities for reporting, analysis, dashboards, data visualization, data discovery, and more to help organizations unlock value from their data.Key capabilities and components of SAP BusinessObjects include:Centralized semantic layer for consistent data across the organizationPowerful...
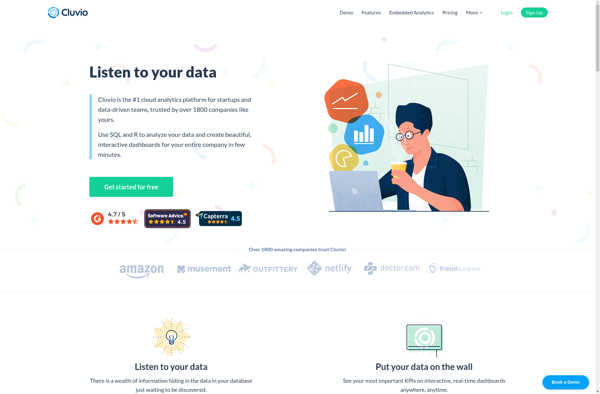
Cluvio is a business intelligence and analytics software designed for small and medium-sized businesses. It aims to make data analytics accessible to non-technical users through an intuitive graphical interface. Some key capabilities and benefits of Cluvio include:Interactive dashboards - Users can create customizable dashboards to visualize important business metrics and...
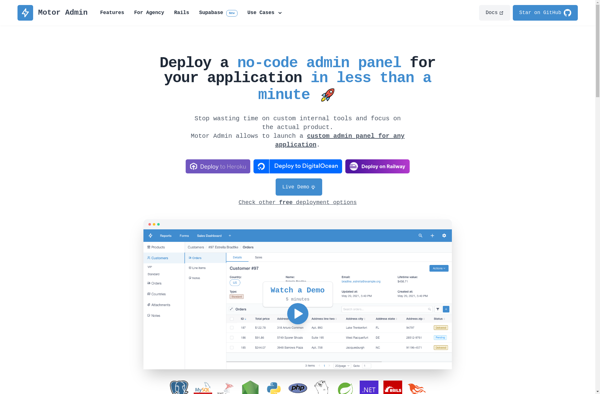
Motor Admin is an end-to-end dealership management software designed specifically for automobile dealerships. It provides a centralized platform to manage key aspects of running a dealership including:Inventory Management - Track all vehicles from acquisition to sale, including accounting, reconditioning and promotions. Manage inventory across multiple locations.Customer Relationship Management - Store...
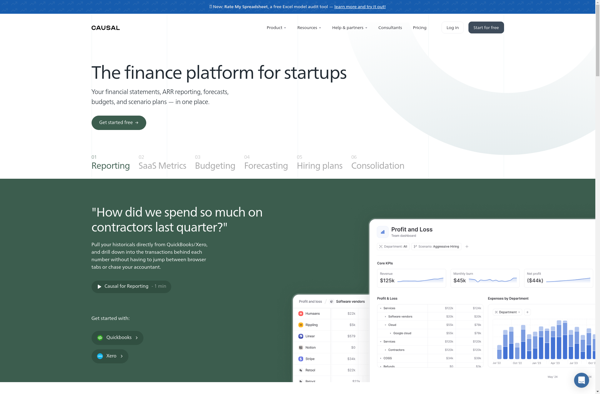
Causal is a software platform designed to help companies and analysts better understand what factors drive changes in key business metrics. It utilizes statistical and machine learning techniques to determine causal relationships in data, as opposed to just correlations.Here are some key capabilities of Causal:Upload transactional data from databases, cloud...
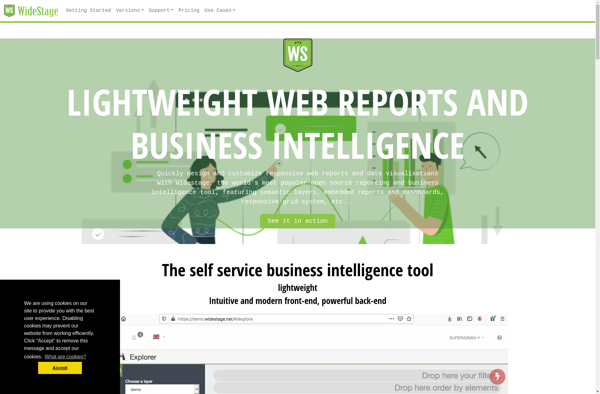
Widestage is an enterprise-grade platform for live video streaming, webinars, and webcasts. It enables businesses, event organizers, education institutions and media publishers to easily broadcast content in real-time to engage with their audience.Key features of Widestage include:Intuitive dashboards for managing live events, presenters, registration, and branding.Robust viewing portal allowing viewers...
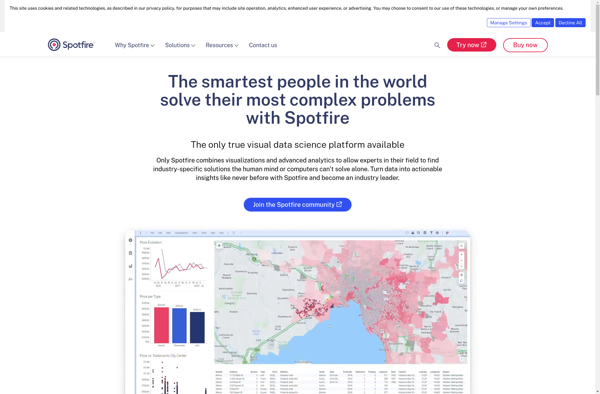
Spotfire is a business intelligence and analytics software platform designed for interactive data discovery and visualization. It enables rapid analysis of large, complex data sets to uncover deeper insights.Key features of Spotfire include:Interactive dashboards and visualizations - Drag-and-drop interface to create customized data visualizations like heat maps, charts, graphs, and...
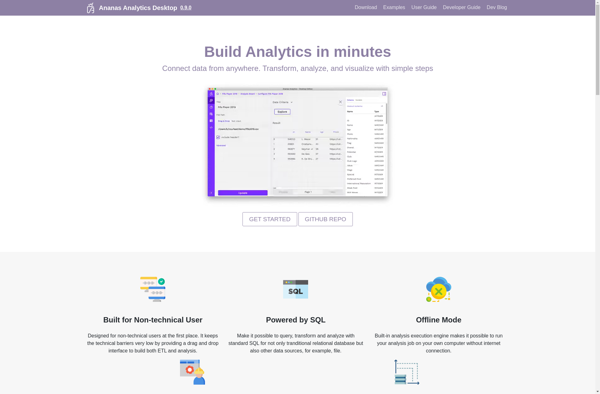
Ananas Desktop is an open-source desktop environment and application suite for Linux and BSD operating systems. Developed as a fork of the Razor-qt project, Ananas aims to provide a lightweight yet fully-featured desktop experience with a focus on speed, stability, and customizability.Some key features of Ananas Desktop include:Lightweight and fast...
Redash is an open-source business intelligence and data visualization web application. It allows users to connect to multiple data sources including SQL databases, query and visualize the data, and create interactive dashboards to share insights.Some key features of Redash:Connect to data sources like PostgreSQL, MySQL, SQL Server, Redshift, BigQuery and...
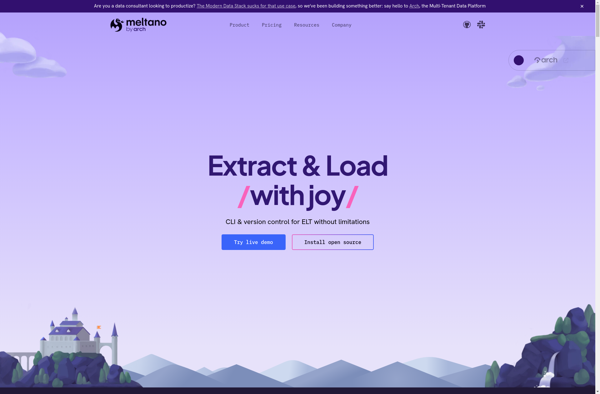
Meltano is an open source data integration and ELT (extract, load, transform) platform aimed at helping data engineers and analysts more easily move, transform, and load data from various sources into data warehouses or visualization platforms. Features include:Visual interface for building data pipelines by connecting data sources, adding transformations, scheduling...
Sisense is a business intelligence and data analytics software platform designed to help non-technical users prepare, analyze and visualize complex data. Some key features of Sisense include:Intuitive drag-and-drop interface for building interactive dashboards and visualizations like charts, graphs and pivot tables without coding.Ability to connect to wide variety of data...
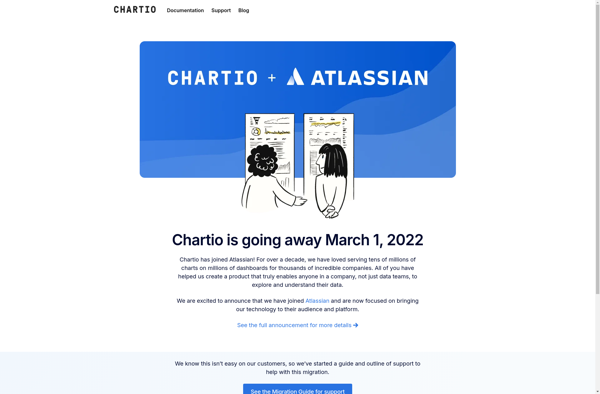
Chartio is a cloud-based business intelligence and data visualization platform designed to help companies analyze data and share actionable insights. It allows users to connect a variety of data sources including databases, cloud apps, and spreadsheets, and build interactive dashboards and charts.Key features of Chartio include:Intuitive drag and drop interface...
DIVE (Data Insight Visualization Explorer) is an open source web application developed by researchers at the MIT Media Lab. It is designed to enable interactive exploration and visualization of complex, multi-faceted datasets.Some key features of DIVE include:Intuitive drag-and-drop interface for rapidly building visualizations like maps, charts, graphs, and moreSupport for...
AnswerMiner is an artificial intelligence-powered software that helps companies improve their customer support operations and experiences. It analyzes large volumes of customer service conversation data, including emails, chat transcripts, and call center notes, to provide actionable insights.The key features and benefits of AnswerMiner include:Understanding Frequent Customer Questions and Pain Points:...
NVD3 is an open-source JavaScript charting library used to build interactive data visualizations in web browsers. It is based on D3.js and reuses parts of the D3 codebase to create reusable charts. NVD3 aims to simplify and streamline D3 code for faster web development.Some key features of NVD3 include:Over a...
LightCat is an emerging open-source password manager that allows users to securely store website logins, credit card numbers, identities, and other sensitive information behind one master password. It utilizes strong AES-256 bit encryption to protect user data and ensures information is accessible only to the owner.Some key features of LightCat...
dc.js is a JavaScript charting library that leverages d3.js and crossfilter for interactive dimensional charting and visual analysis of large datasets. Some key features of dc.js include:Integration with d3.js for powerful and flexible visualizationsTight integration with crossfilter for fast filtering and grouping of large datasetsFocus+Context and Brushing chart interactionsAnimated transitions...
Many Eyes is a public web application launched in 2007 by IBM Research for visualizing data and creating interactive visualizations. It allows users to upload datasets in various formats, create visualizations like charts, graphs, maps, networks and trees based on the data, and publish them for public viewing and analysis.Some...
MicroStrategy is a leading enterprise analytics platform designed to help organizations make data-driven business decisions through advanced visualization and dashboarding capabilities. It serves as a one-stop solution for BI, allowing for data preparation, discovery, reporting, and predictive analytics.Key features of MicroStrategy include:Interactive dashboards and pixel-perfect reports that can be accessed...
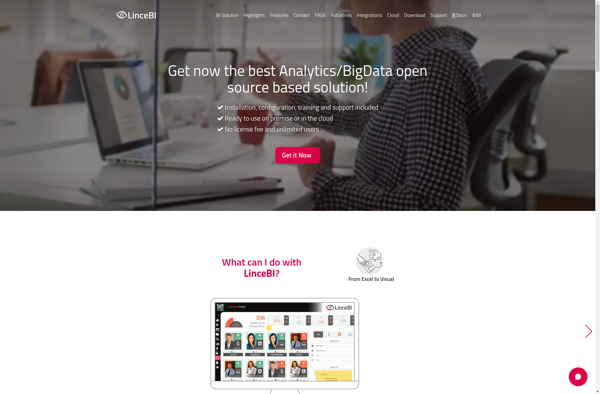
LinceBI is an open-source business intelligence and data visualization platform used to analyze and visualize data for better business insights. It provides an intuitive drag-and-drop interface to create interactive dashboards, reports, charts and graphs without the need for coding.Some key features of LinceBI include:Connectivity to multiple data sources such as...
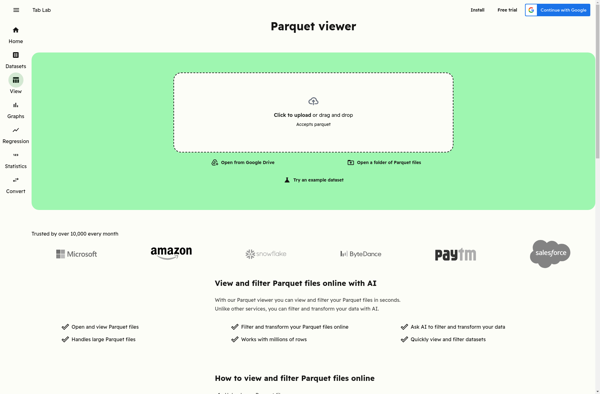
Parquet Data Viewer is an open-source, cross-platform application for visually analyzing and exploring Parquet data files. Developed by Atlan, it provides an intuitive graphical interface to examine the contents of Parquet files without needing to write code.With Parquet Data Viewer, you can quickly:See the data types, compression types, row group...
Amazon QuickSight is a fast, cloud-powered business intelligence service that makes it easy to build visualizations, perform ad-hoc analysis, and quickly get business insights from your data. Some key features include:Intuitive visual interface that makes it easy to visualize and explore dataBroad data connectivity to connect to data sources like...
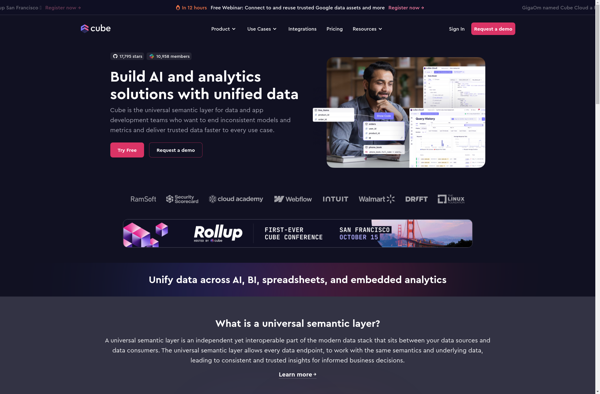
Cube.js is an open-source analytics framework for building cloud-native business intelligence dashboards and applications. It provides a flexible way to analyze and visualize data by generating a data model on top of data warehouses or databases.Some key capabilities and benefits of Cube.js include:Auto-generating a data schema to power analystics dashboards...
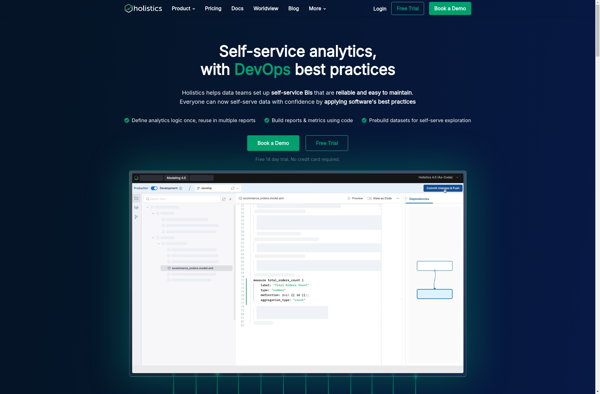
Holistics is an AI-powered unified data platform designed to help companies build and manage their data infrastructure. It provides an intuitive interface for data teams to ingest, prepare, analyze, and visualize data from diverse sources.Key capabilities include:Smart data collection and ingestion from databases, cloud apps, APIs etc.Automated data mapping, cleansing,...
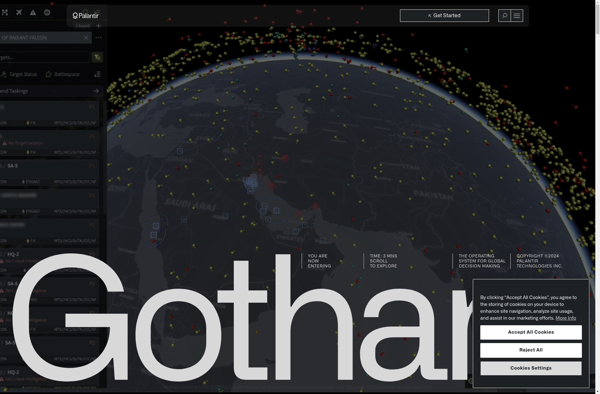
Palantir Gotham is a powerful big data analytics platform optimized for integrating, managing, and analyzing large, complex data sets from disparate sources. It is used by government agencies and large enterprises to improve operations and decision-making.Key capabilities and features of Palantir Gotham include:Data integration - Ingest, standardize, deduplicate, and integrate...
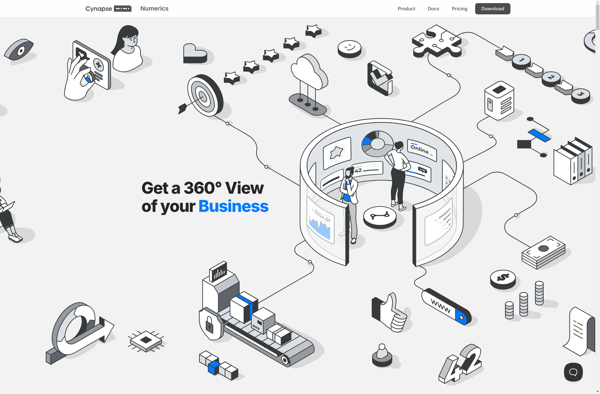
Numerics is an open-source data analysis and visualization application designed for engineering, science, finance, and other domains that work with numeric data. It provides a flexible platform for analyzing, transforming, and visualizing numeric datasets of virtually any size and dimension.Some of the key features and capabilities of Numerics include:Importing and...
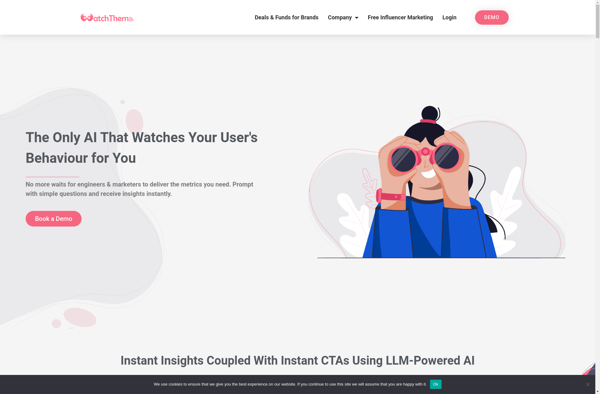
WatchThemLive is a feature-rich live streaming and webcasting platform suitable for businesses, event organizers, teachers, and content creators looking to engage with their audience in real-time over the internet. Some key capabilities and benefits of WatchThemLive include:Multi-bitrate adaptive streaming for high quality broadcasts across devices and network conditionsInteractive features like...
dotnet Report Builder is an open-source reporting tool designed specifically for .NET applications. It allows .NET developers to create rich, customizable reports for both web and desktop applications with minimal coding.Some key features of dotnet Report Builder include:Supports connecting to various data sources like SQL Server, Oracle, MongoDB, REST APIs,...
ChartExpo is a versatile business intelligence and data visualization software designed to help companies visualize and analyze data through interactive dashboards. It allows users to connect to various data sources including SQL databases, cloud apps, Excel files, etc. and pull data into the software.Some key features of ChartExpo include:Drag-and-drop interface...
Stratifyd is a cloud-based business intelligence and analytics platform suitable for companies of all sizes. It helps businesses organize data from multiple sources, analyze it using AI and machine learning capabilities, and gain actionable insights to improve decision-making.Key features and benefits include:Automated ETL processes to combine and prepare data from...
EZlytix is a business intelligence and data analytics software designed to help companies make data-driven decisions. It allows users to connect to various data sources, prepare and cleanse data, and create interactive dashboards and reports to gain insights.Some key features of EZlytix include:Intuitive drag-and-drop interface to build workflows, dashboards and...
QueryTree is a visual SQL analytics software designed to make query building fast and easy for any skill level. It features an intuitive drag-and-drop interface that allows users to construct complex SQL queries visually without typing code.Some key features of QueryTree include:Visual query builder with drag-and-drop fields and quick type...
Zebra BI is a business intelligence and analytics software that empowers business users to visualize and analyze data independently, without relying on IT teams. Some key capabilities and benefits of Zebra BI include:Intuitive drag-and-drop interface for data modeling, visualization design, and dashboard creationConnectors to a wide variety of data sources...
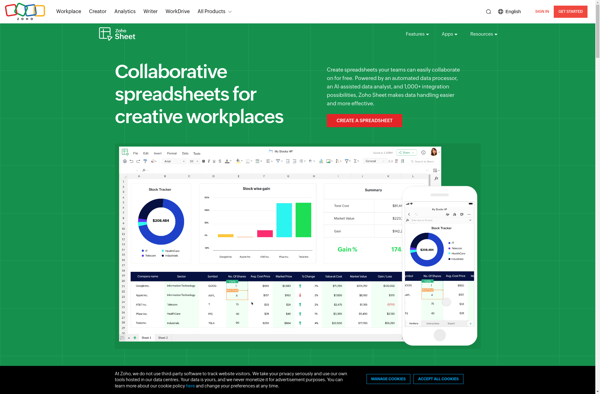
Zoho Sheet is an online spreadsheet software application developed by Zoho Corporation. It is part of the Zoho Office Suite which includes other office productivity tools like a word processor, presentation software, and more.As an online spreadsheet software, Zoho Sheet provides core spreadsheet functionality like calculations, pivot tables, charts, and...
Datapine is an easy-to-use business analytics and dashboard software designed to help businesses visualize, analyze and gain insights from their data. It provides powerful tools to access, clean, unify and model data from multiple sources, including SQL and NoSQL databases, cloud apps, spreadsheets, CSV files and more.Key features of Datapine...
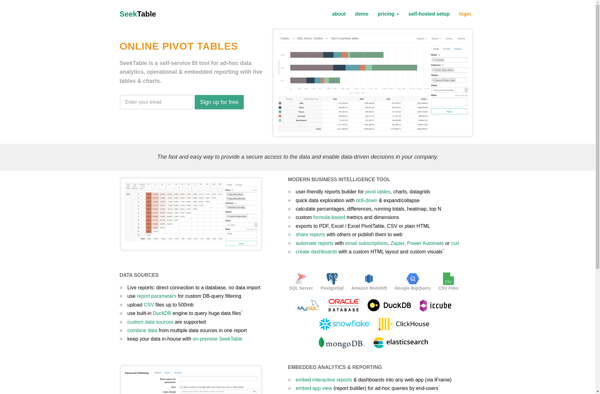
SeekTable is a browser extension and web app that helps you navigate websites more efficiently. It works by outlining tables, charts, and graphs on web pages so you can easily scan, search, and summarize data.Once installed, SeekTable will detect tables, charts, and graphs on a web page and draw red...
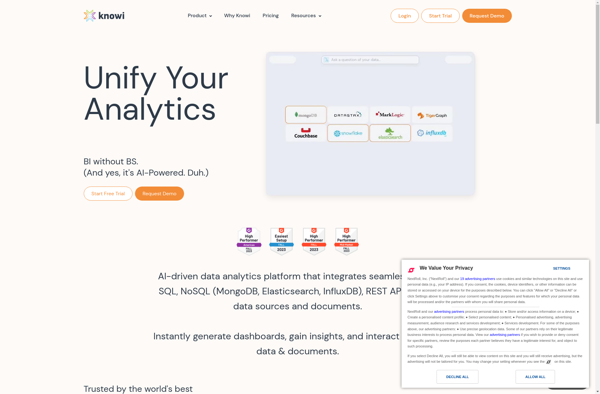
Knowi is a business intelligence and analytics software that provides tools for data visualization, reporting, and dashboard creation. It allows non-technical users to easily access, analyze, and visualize data without needing to know SQL or coding.Some key features of Knowi include:Drag-and-drop interface to build interactive dashboards, charts, reports and visualizationsBroad...
JetPack Data is a comprehensive data management and analytics platform designed to help companies make better use of their data. It provides a suite of tools to ingest, store, analyze, and visualize data from a variety of sources.Key features of JetPack Data include:Flexible data ingestion from databases, cloud apps, files,...
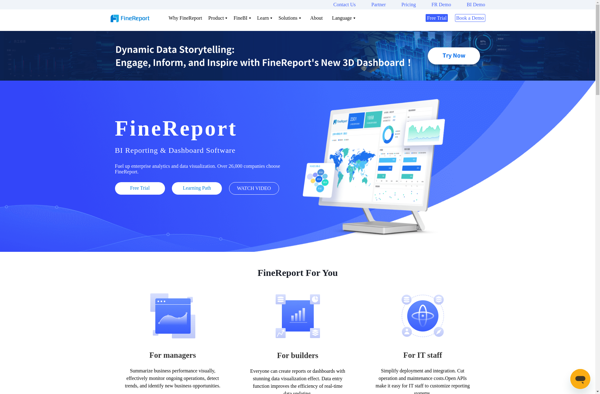
FineReport is a business intelligence and reporting solution developed by FineReport Software Co., Ltd. It provides an intuitive drag-and-drop interface for report design, allowing users to easily create interactive and visually engaging reports, dashboards, and data visualizations.Some key features of FineReport include:Connectivity to a wide range of data sources like...
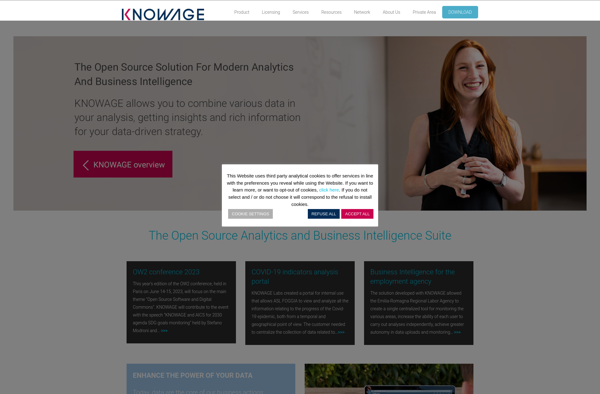
Knowage is an open-source business intelligence and data analytics platform. It provides a wide range of features for extracting insights from data, including:Interactive dashboards and reports for data visualizationAd-hoc reporting and analysisAdvanced data visualization with charts, graphs, and mapsData mining and OLAP analysisScorecards and KPI managementData integration from multiple sourcesResponsive...
Notion Analytics is a business intelligence and data visualization software used by organizations to create visually appealing dashboards connected to various databases and analytics tools. It has an intuitive drag-and-drop interface that enables users to model data and build reports and dashboards without needing to code.Key features of Notion Analytics...
Angoss KnowledgeSEEKER is a comprehensive data mining and predictive analytics platform used to uncover patterns and relationships in data to improve decision making. It helps organizations leverage their data by providing capabilities for:Data preparation and cleansing - KnowledgeSEEKER provides tools to profile, cleanse, transform, aggregate, sample, and partition data to...
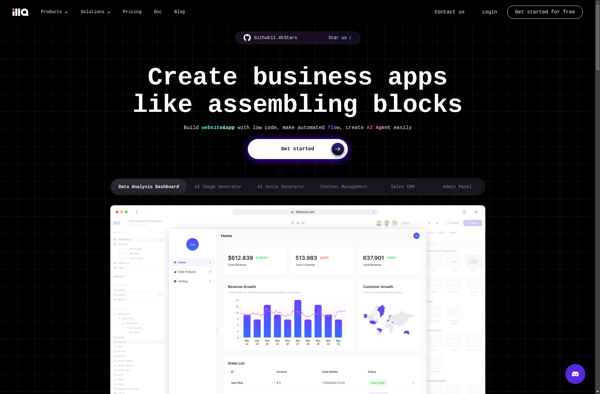
ILLA Cloud is a purpose-built cloud infrastructure designed specifically for the life sciences industry. It provides researchers, scientists, and IT teams with on-demand access to secure and compliant computing resources to power their data-intensive workloads.Key features and capabilities of ILLA Cloud include:Flexible compute options including cloud VMs, bare-metal servers, and...
Marple is an open-source, Markdown-based slide deck tool for creating presentations. It provides a minimalistic editor interface to write slide content in Markdown format, which then gets rendered into an elegant slide deck for presenting.Some key features of Marple:Write slide content in easy-to-read and write Markdown format. Format headings, lists,...
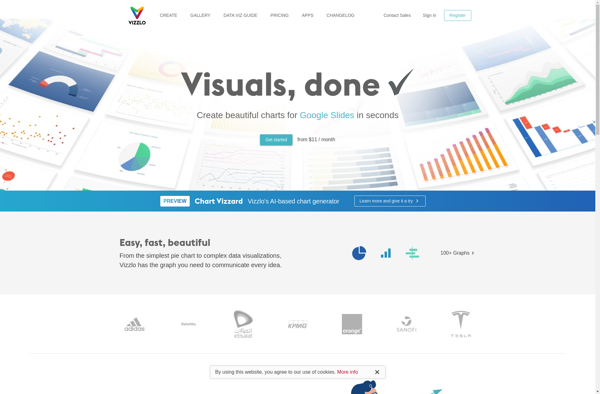
Vizzlo is an easy-to-use data visualization and infographic software tool that empowers anyone, regardless of design experience, to create beautiful, professional data visualizations, infographics, presentations and reports in just minutes.With an intuitive drag-and-drop interface and access to a massive library of charts, maps, shapes and illustrations, Vizzlo makes it simple...
Chartrics is a powerful yet easy-to-use data visualization and analytics platform for creating interactive charts, graphs, and dashboards. With its intuitive drag-and-drop interface, anyone can quickly turn raw data into meaningful visualizations and share insights.Key features of Chartrics include:Import data from a variety of sources like CSVs, databases, and other...
GGobi is an open-source, multi-platform software application for interactive exploratory data analysis. It allows users to visualize high-dimensional datasets by leveraging interactive graphics such as scatterplots, parallel coordinates, star glyphs, time series plots, tours (animation sequences for exploring n-dimensional data spaces), as well as dimension reduction techniques like principal components...
Vega Voyager is an open-source data visualization tool developed by the University of Washington Interactive Data Lab. It provides a user-friendly graphical interface for rapidly creating custom interactive visualizations from tabular dataset inputs without writing any code.With Vega Voyager, users can simply drag-and-drop their dataset and select desired visualization types...
Stagraph is a powerful yet easy-to-use data visualization and analytics platform designed for modern business needs. As a cloud-based solution, Stagraph enables users to effortlessly map, analyze, and gain actionable insights from even the most complex data sets through intuitive drag-and-drop visualizations.Key capabilities and benefits include:Intelligible and interactive data visualizations...
InfoCaptor Dashboard is a business intelligence and analytics platform designed to help companies consolidate their data, create customized dashboards and reports, and uncover valuable insights. Some key features of InfoCaptor Dashboard include:Data connectivity and ETL - Connect to data from multiple sources like SQL and NoSQL databases, cloud apps, Excel,...
Teradata is a leading enterprise data warehousing solution designed for large-scale data storage, management, and analysis. It leverages parallel processing and advanced database design to enable high-performance analytics on petabyte-scale data volumes.Some key capabilities and benefits of Teradata include:Massive scalability and storage capacity for storing hundreds of terabytes to petabytes...
Cirkulate is an open-source, self-hosted alternative to Google Analytics that allows web developers and site owners to track traffic and analyze usage statistics without compromising visitor privacy. Some key features of Cirkulate include:Lightweight and easy to install. Cirkulate uses a SQLite database and PHP scripts, making it simple to set...
DigDash Enterprise is a feature-rich business intelligence and analytics platform tailored for large enterprises. It enables organizations to aggregate data from multiple sources, gain actionable insights, and make data-driven decisions.Key capabilities include:Data connectivity - Connect to 100+ data sources such as databases, cloud apps, big data platforms, etc. Integrates nicely...
Dotmatics Vortex is a scientific informatics software platform used by pharmaceutical, biotechnology, and other research organizations to efficiently capture, store, analyze, and share chemical and biological data.Key features of Dotmatics Vortex include:Chemical registration system to store and search compounds and associated dataBio registration system to store and search biological entities...
Lightdash is an open-source business intelligence and analytics platform for building interactive dashboards and reports. It allows you to visualize and explore your data to uncover insights and make better decisions.Some key features and capabilities of Lightdash include:Connect to a wide range of data sources like MySQL, PostgreSQL, BigQuery, and...
Keikai is an open-source web-based spreadsheet application that allows users to create, view, edit, and share spreadsheets through a web browser. Developed in Java, it runs on the server-side and enables online collaboration between multiple users on spreadsheets in real-time.Similar to desktop-based spreadsheet software like Microsoft Excel or Google Sheets,...
RAWGraphs is a free, open-source web tool created for anyone to easily visualize and share data using the most common graphical formats. The simple drag and drop interface makes it easy for non-experts to quickly generate a wide variety of charts and diagrams that can be exported and shared as...
Phrazor is a cloud-based plagiarism detection software designed for educational institutions. It allows teachers and administrators to check student submissions such as essays, reports, code, and more for plagiarism by comparing the content against its extensive database of web sources as well as previously submitted student work.Some key features of...
EzDataMunch is a no-code data preparation and analytics platform designed to empower anyone to work with data, regardless of technical skillset. It provides an easy-to-use graphical interface to combine, clean, enrich, and analyze data without the need to write any code.With EzDataMunch, you can connect to various data sources like...
DataMill is an open-source data catalog and metadata management solution designed to help organizations get more value from their data. Here are some key capabilities:Automated data discovery and cataloging - DataMill crawls data stores like databases, data warehouses, file shares etc. to automatically catalog metadata and make data sets discoverable.Searchable...
Amber Form Maker is an intuitive online form building application that enables users to create professional-looking web forms and surveys without writing any code. It comes packed with powerful features that make form creation easy and efficient.With its user-friendly drag-and-drop editor, you can build forms in minutes by simply dragging...
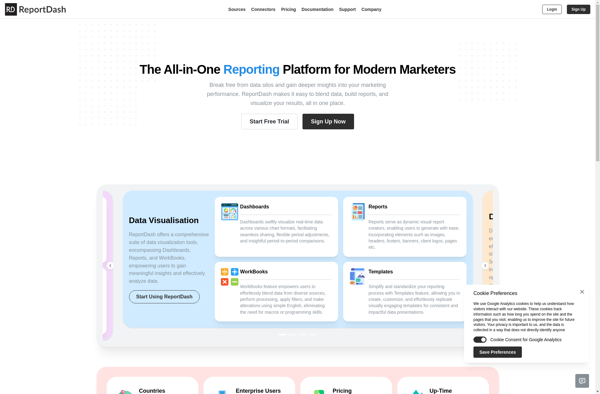
ReportDash is a versatile business intelligence and analytics platform suitable for companies of all sizes. It allows users to connect to various data sources, clean and transform data, and create interactive reports and dashboards that provide actionable insights.Key features include:Intuitive drag-and-drop interface to build reports and dashboards quicklyVariety of customizable...
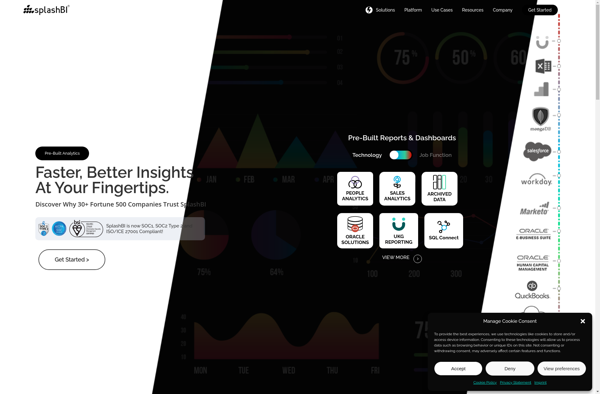
SplashBI is a cloud-based business intelligence and data visualization platform designed for small and medium businesses. Some key features of SplashBI include:Intuitive drag-and-drop interface for building interactive dashboards, charts, tables and reportsLibrary of customizable widgets and visualizations including bar, line and pie chartsAutomated report scheduling and distributionReal-time data connectivity to...
Datacopia is an open-source data workflow and pipeline tool designed for integrating, moving, and transforming data across databases, data warehouses, lakes, and other systems. It provides an easy to use visual interface to build and manage complex data pipelines without coding.Key features of Datacopia include:Visual data pipeline designer to model...
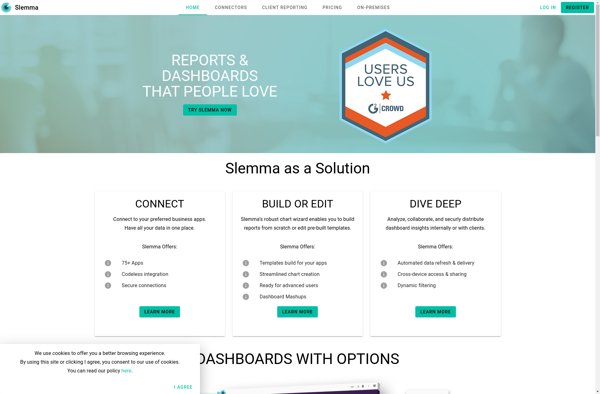
Slemma is an open-source alternative to Grammarly that provides AI-powered grammar and spelling correction for your writing.With Slemma, you can paste in any text and it will analyze it using natural language processing to find typos, grammatical mistakes, and other writing issues. As you type or edit text, Slemma underlines...
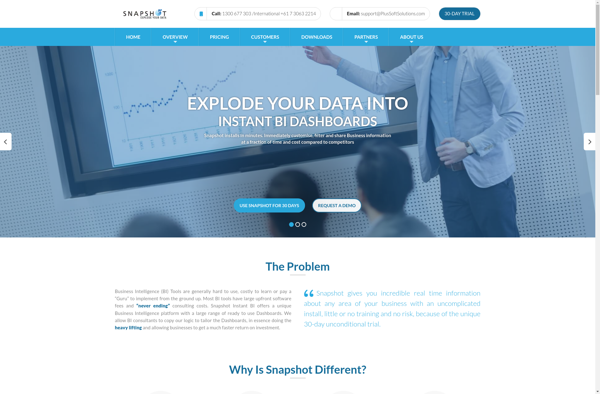
Snapshot BI is a business intelligence and analytics software designed specifically for small and medium-sized businesses. It provides an easy-to-use platform for companies to visualize, analyze, and gain actionable insights from their business data.Key features of Snapshot BI include:Interactive dashboards and reports - Create customized dashboards with drag-and-drop widgets to...
Parrily is a cloud-based project management and team collaboration software designed specifically for agile development teams. It provides a variety of features to help manage projects, track progress, and facilitate teamwork:- Kanban boards - Visualize tasks and user stories on digital kanban boards. Move items through defined workflows to track...
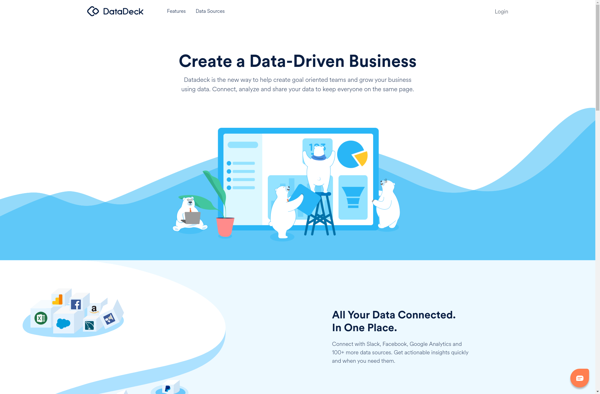
Datadeck is a business intelligence and data analytics platform designed to make working with data accessible for users of all technical skill levels. It provides an intuitive graphical interface that allows anyone to easily connect to data sources like databases, cloud apps, Excel, etc., and visualize and explore that data...
KiniMetrix is a cloud-based software platform designed for healthcare providers to help them better manage their practices, engage with patients, gain population health insights, and handle administrative tasks. It combines features typically found in separate electronic health record (EHR), practice management, patient portal and business intelligence solutions into one unified...
Birst is a cloud-native business intelligence and analytics platform used by enterprises to unify, understand, and act on data. Key capabilities and benefits include:Cloud data warehousing to bring together data from multiple sources for analysisInteractive dashboards and visualizations to spot trends and insightsSelf-service analytics empowering users across the organization to...
XLCubed is an Excel add-in designed specifically for financial analysts and modelers. It enhances Excel by providing commonly used financial functions, keyboard shortcuts, flexible graphing tools, and auditing features to improve model quality.Some of the key features of XLCubed include:Hundreds of financial and math functions like IRR, XNPV, XIRR, and...
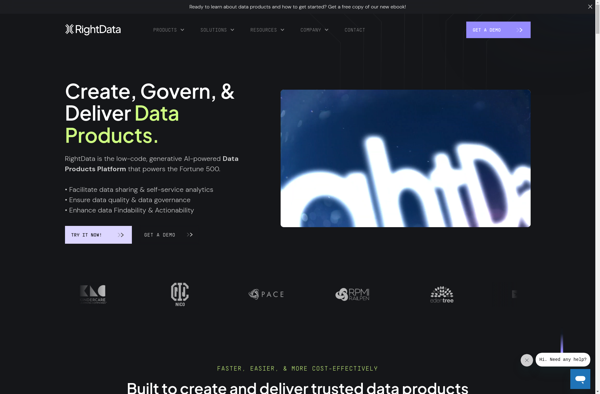
RightData is a data governance and stewardship platform designed to help organizations effectively manage their enterprise data. It provides a range of capabilities including:Data discovery and cataloging - RightData crawls data sources like databases and files to create a catalog with technical and business metadata. This helps organizations understand what...
Datawatch is a business intelligence and analytics platform designed for self-service data preparation, reporting and visualization. Some key capabilities and features of Datawatch include:Data Connectivity - Datawatch can connect to a wide variety of data sources like databases, applications, flat files, big data platforms and more. It provides connectivity to...
The Epoch Charting Library is an open-source JavaScript charting library designed for building a wide range of interactive browser-based data visualizations. It provides a simple yet powerful API for defining chart types like bar charts, line charts, scatter plots, pie charts, area plots, and more. The library handles details like...
Gaio is an open-source monitoring and observability platform optimized for cloud-native infrastructure and applications. It provides comprehensive visibility into systems, services, and applications deployed in public, private, or hybrid cloud environments.Some key capabilities and benefits of Gaio include:Metrics - Ingest, process, store and visualize metrics from hosts, containers, services, and...
AVORA is a free, open-source video conferencing software designed for online meetings, webinars, remote teaching and other collaborative tasks. It provides high-quality audio and video communication in a customizable virtual meeting space.Some key features of AVORA include:Real-time HD video and crystal clear audio for natural conversationsScreen sharing to present slides,...
Traken is a business intelligence and analytics platform designed to help companies manage their data pipelines, workflows, and analytics. It provides an intuitive drag-and-drop interface for ingesting data from various sources, processing and transforming it, and analyzing and visualizing it through interactive dashboards.Some key capabilities and benefits of Traken include:Flexible...
Dyntell Bi is a self-service business intelligence and data visualization software designed to help companies make data-driven decisions. It allows users to connect to a wide range of data sources including SQL databases, cloud apps, and Excel files to import data.Once the data is imported, Dyntell Bi provides an intuitive...
Cortana Analytics is an integrated suite of intelligence tools and services from Microsoft designed to help organizations make data-driven decisions. It includes the following core components:Azure Machine Learning - A cloud service for building and deploying predictive analytics solutions and machine learning modelsHDInsight - Managed Hadoop, Spark, and other big...
ggvis is an R package developed by RStudio for building interactive data visualizations. It allows users to create rich graphics and plots that can be embedded in web pages and applications. Some key features of ggvis include:Builds on the popular ggplot2 graphics package in R, so it is easy for...
Bime is a flexible business intelligence and analytics platform suitable for modern data teams. It provides an easy way to connect to various data sources like databases, cloud apps, and business software to build interactive dashboards, reports, and analytics.Some key capabilities and benefits of Bime include:Intuitive drag-and-drop interface to visualize...
VizualSurvey is a powerful yet easy-to-use online survey creator that empowers users of all skill levels to make professional surveys in minutes. With its intuitive drag-and-drop builder and variety of customizable themes, even beginners can design great-looking online forms tailored to their needs.Some key features of VizualSurvey include:Drag-and-drop survey builder...
CircleBI is a flexible business intelligence and analytics platform used by companies to visualize data and uncover insights for better decision making. It provides interactive dashboards, reports, and charts that connect to various data sources like databases, spreadsheets, etc.Key features of CircleBI include:Customizable dashboards to monitor KPIsAd-hoc reporting to quickly...
Salford Systems is a San Diego-based software company founded in 1983 that develops advanced analytics and data mining software. Their main products include:CART - classification and regression tree algorithm softwareMARS - multivariate adaptive regression splines modelingTreeNet - stochastic gradient boosting and random forestsRandom Forests - ensemble learning method for classification...
ClearStory Data is a big data analytics software platform designed to help organizations access, analyze, and collaborate around their rapidly growing volumes and varieties of enterprise data. Some key capabilities include:- Data Harmonization - Ingest, combine, and prepare multiple disparate data sources including structured, multi-structured, and unstructured data.- Fast Data...
Analyza is a business intelligence and data analytics software platform designed to help companies make data-driven decisions. It provides tools for data preparation, interactive visualization, dashboarding, reporting, and predictive analytics.Key features of Analyza include:Intuitive drag-and-drop interface for building dashboards and reports without codingHundreds of customizable data visualization options including charts,...
Mode Analytics is a powerful, cloud-based business intelligence and analytics platform designed to help companies visualize, analyze, and share data to drive better business decisions. With an intuitive drag-and-drop interface, Mode makes it easy for users to connect multiple data sources, build interactive reports and dashboards, and collaborate across teams.Some...
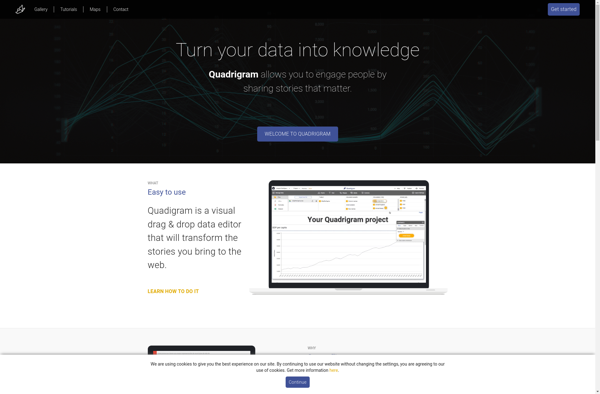
Quadrigram is an open-source grammar, spelling, and style checking software. It was created as an alternative to commercial options like Grammarly or Microsoft Editor. Quadrigram analyzes written text and uses natural language processing and machine learning algorithms to detect grammar, spelling, punctuation, and other stylistic issues.Key features of Quadrigram include:Grammar...
Palantir Metropolis is a powerful data management and analytics platform developed by Palantir Technologies. It is designed to help organizations integrate, manage, analyze, and act on massive amounts of disparate data.Some key capabilities of Metropolis include:Data integration - Ingest, standardize, and connect data across siloed sources into a common data...
Alpine Data Labs is an end-to-end predictive analytics platform designed for data science teams to build and deploy predictive models. It aims to make advanced analytics more accessible and collaborative.Key features of Alpine Data Labs include:Intuitive graphical interface for loading data from various sources, cleaning and munging data, exploring relationships,...
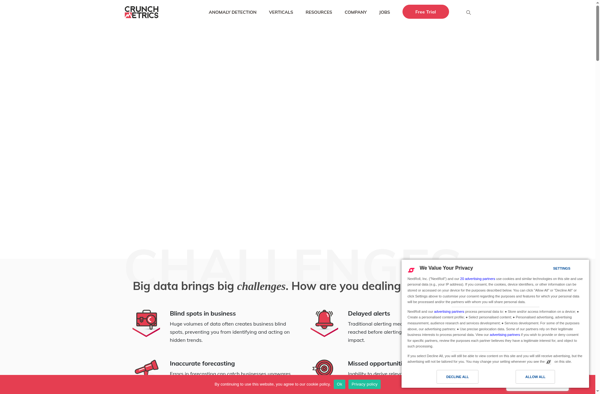
CrunchMetrics is a business intelligence and data analytics software platform aimed at helping companies make data-driven decisions. It allows users to connect to various data sources, clean and transform data, and create interactive dashboards and reports to gain insights.Key features of CrunchMetrics include:Drag-and-drop interface to build dashboards with charts, tables,...
Centius Qi is an intuitive, code-free business automation platform powered by artificial intelligence. It helps companies eliminate manual processes, automate repetitive tasks, and streamline workflows across the organization.With an easy-to-use drag and drop interface, Centius allows anyone to build workflows, set up integrations, create intelligent chatbots, gather actionable insights from...
YellowFin is an open-source autoML library for Python that automates the tuning of hyperparameters and model architecture search to help users achieve high accuracy with machine learning models. Developed by researchers at MIT, IIT, and Adobe Research, YellowFin aims to make state-of-the-art machine learning techniques accessible to non-experts.Some key capabilities...
Mantle Enterprise Analytics is a robust business intelligence and analytics solution catered towards large enterprises. It provides a wide range of capabilities to collect, store, process, analyze, and visualize data across the organization.Key features include:Interactive dashboards and reports for data visualizationPredictive modeling, forecasting, and machine learning algorithmsConnectors to extract data...
Stansa is a free software that specializes in transcription. It allows users to transcribe audio or video files easily and efficiently. Some key features of Stansa include:Intuitive and user-friendly interface - The software has a clean, simple design that is easy for beginners to understand and start using quickly.Automated transcription...
ProClarity is a business intelligence and analytics software designed to help organizations make data-driven decisions. It provides an interactive dashboard and data visualization capabilities to easily analyze large datasets from multiple sources.Key features of ProClarity include:Drag-and-drop interface to quickly build dashboards and visualizationsBroad connectivity to import data from SQL Server,...
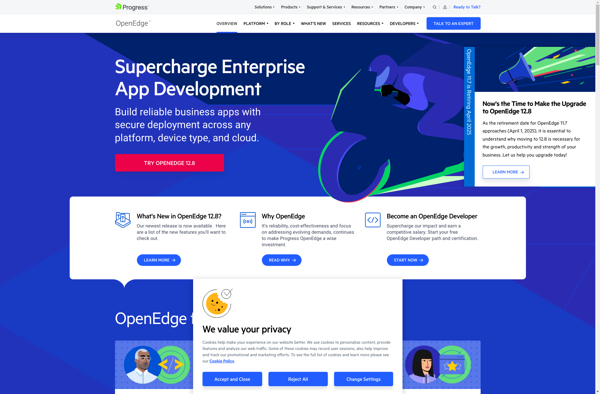
Progress OpenEdge is a development platform optimized for creating business applications. It includes a 4th generation programming language (4GL) designed for rapid application development along with tools for building user interfaces, reporting, integration, and application management.Key features of Progress OpenEdge include:4GL language for faster coding and reduced maintenance costs compared...
Planchette Online is a free web-based Ouija board experience that allows users to have a simulated séance without needing to purchase a physical Ouija board. Users simply visit the Planchette Online website and are greeted with a realistic 3D rendering of a classic Ouija board on a wooden table.To start...
JReport is a business intelligence and reporting tool used to create interactive reports and dashboards from multiple data sources. It has an easy-to-use drag-and-drop interface that allows non-technical users to quickly build reports and visualize data without coding.Some key features of JReport include:Connecting to various databases, cloud apps, big data...
Soley Studio is an open-source modeling tool for creating UML diagrams and Business Process Model and Notation (BPMN) workflows. It provides a comprehensive environment for software design and business process modeling.With its simple and intuitive graphical interface, Soley Studio makes it easy to build various diagrams such as use case...
Sympathy for Data is an open-source data visualization and analytics platform used by data scientists, analysts, and business users to understand trends and patterns in complex data sets. It was created by a team at Urika, LLC as an alternative to proprietary business intelligence tools.Key features of Sympathy for Data...
Owlata is a customer data platform (CDP) and marketing automation software designed to help B2C companies collect customer data from all touchpoints, build unified customer profiles, derive actionable insights, and orchestrate personalized omnichannel campaigns.Key capabilities and benefits include:Unified Customer Profiles - Consolidate customer data from all online and offline sources...
bipp Analytics is a business intelligence and data visualization software that empowers users to connect their data, analyze it visually, and extract meaningful insights. Some key features of bipp Analytics include:Data Connectors - Connect your data from databases, cloud apps, Excel, etc. with pre-built connectors.Interactive Dashboards - Build visually appealing,...
Bouquet is an open-source and free office suite that provides alternatives to Microsoft Office apps like Word, Excel, and PowerPoint. It includes a word processor, spreadsheet program, and presentation software that allows users to create, edit, and share documents, spreadsheets, and slide decks.The word processor, Bouquet Words, provides similar functionality...
Polar SpreadSheet 2020 is a feature-rich spreadsheet application designed for data analysis professionals, financial analysts, scientists, and other power users. Some key features of Polar SpreadSheet 2020 include:Powerful calculation engine that can handle large, complex spreadsheets with over 1 million rows and 16,000 columnsHundreds of built-in formulas and functions for...
Kubit is an open-source, self-hosted alternative to Trello for agile and kanban-style project management. Here is an overview of its key features and capabilities:- Create boards to represent projects, with flexible columns for tracking workflow. Common columns include Backlog, To Do, In Progress, Testing, Done.- Within each board, add customizable...
DataPad is a user-friendly data analysis and visualization software designed for researchers of all levels. With its intuitive drag-and-drop interface, DataPad allows users to easily import, clean, analyze and visualize complex datasets without coding.Key features include:Import data from CSV, Excel, databases and other sourcesInteractive drag-and-drop workflow to clean, analyze and...
Pyramid Analytics is an advanced business intelligence and analytics platform designed to empower organizations to make faster, more informed decisions. It combines governed self-service analytics capabilities with artificial intelligence-powered features to enable employees to easily access, explore, and act on governed data.Key capabilities of Pyramid Analytics include:Unified governed self-service analytics...